2.61 Explanation
Category: Philosophy of Science
Keywords: explanations, explanatory, explanation, explaining, explained, reduction, emergent, emergence, explains, bridge, reductionist, hempel, reductionism, explain, reductive
Number of Articles: 260
Percentage of Total: 0.8%
Rank: 60th
Weighted Number of Articles: 279.5
Percentage of Total: 0.9%
Rank: 56th
Mean Publication Year: 1985.1
Weighted Mean Publication Year: 1984.9
Median Publication Year: 1986
Modal Publication Year: 1967
Topic with Most Overlap: Laws (0.046)
Topic this Overlaps Most With: Functions (0.0321)
Topic with Least Overlap: Beauty (0.00021)
Topic this Overlaps Least With: Dewey and Pragmatism (0.00048)
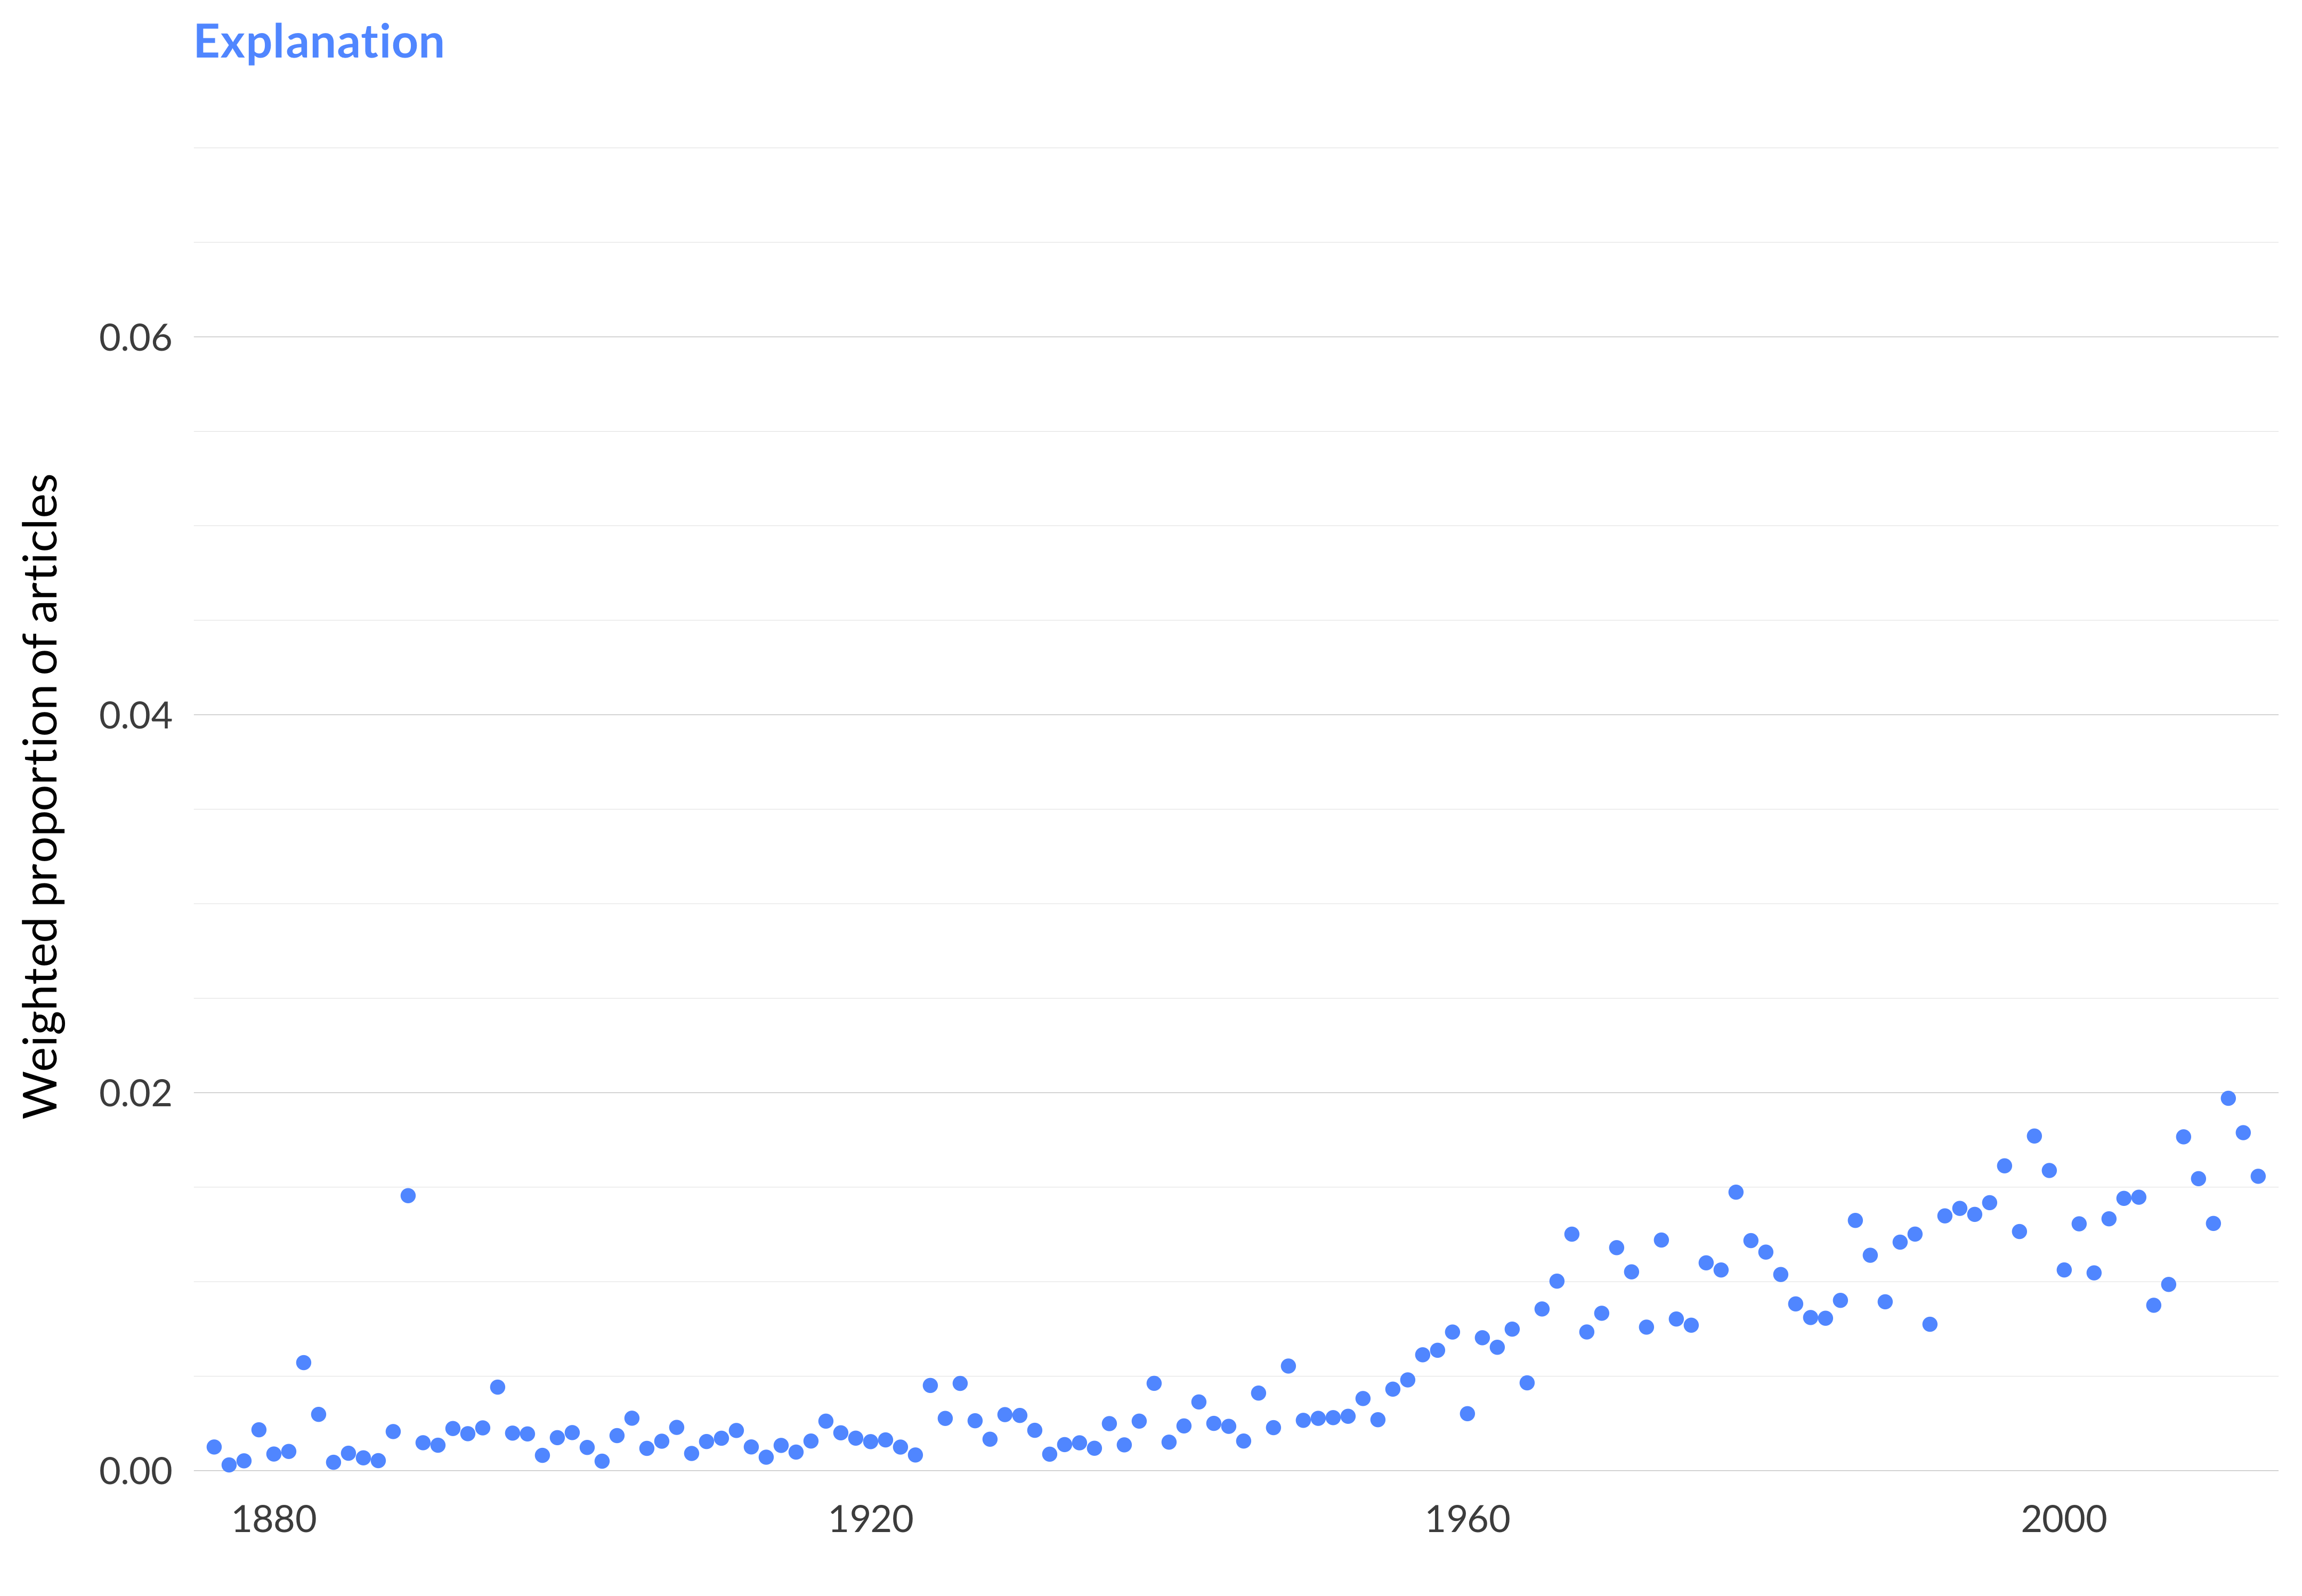
Figure 2.142: Explanation.

Figure 2.143: Explanation articles in each journal.
Comments
I’ve called this explanation, but that’s potentially misleading. It’s really focussed on noncausal approaches to explanation. I suspect that’s less because noncausal theories of explanation are distictive, and more because there are so many other topics that discuss causation.
This topic ends up being somewhat squeezed, so the numbers here understate the importance of explanation as a topic. Some papers you might intuitively classify as being about explanation end up in causation. Others end up in laws. Yet others end up in theories and realism. So the numbers here are more of a lower bound for the importance of explanation than anything else.
That said, the upward trend here is a bit interesting to me. I wouldn’t have expected that just from the topic. Part of the story is that this topic also includes papers on reduction (at least if they didn’t get classified in laws or in theories and realism), and there was a bit of a regrowth of interest in that in the 2000s and early 2010s.