2 The Ninety Topics
In this chapter I go through all ninety topics that the model generates. I’ll present a bunch of automatically generated facts about each topic, then say something about either the history of the topic or how it fits into the larger model. In this introduction I’ll explain how each of the automatically generated facts is in fact generated, using the example of topic 21.
As can be seen in the sidebar, each topic has a number and a name. The numbers are taken from the age of the articles in the topic. Lower numbers pick out older topics. While working through the ninety topics, the closer and closer one gets to the present of philosophy. The names are things that I supplied. The statistics that follow are mostly the things I was looking at when I gave each topic its name.
I’ve put each topic into one (or sometimes two) categories. These are the familiar disciplines of contemporary philosophy: metaphysics, ethics, history, and the like. For early modern, the categorization was easy.
Category: History of Philosophy
For each topic, the model generates something such as a probability of a word turning up given that an article is certainly) in that topic. That can be used to generate keywords for each topic. But there are a couple of hitches.
The first thing I tried was to identify the keywords for a topic with the words that have the highest probability of turning up in articles in that topic. But that gives the same keywords for most of the topics. Indeed, for every topic it gives keywords that were borderline cases of being stop words.
The second thing I tried was to identify keywords using those words where the ratio between the probability the word turns up in this topic with the probability it turns up in an arbitrary article. This is better but still not right. Doing this makes all the keywords incredibly rare words that essentially never turn up in any other topic. (Occasionally this would make weatherson a keyword, for example, though not usually where I expected.)
What I settled on was to use that ratio but only quantify the words that are at least reasonably common across the data. Roughly, they are words that turn up at least once in every twenty thousand words (excluding stop words).9 Applied to early modern, that gives us the following keywords:
Keywords: descartes, spinoza, leibniz, cartesian, substance, substances, intellect, vii, ideas, attributes, modes, doubt, attribute, innate, berkeley
Hopefully it isn’t too surprising now why I called this early modern. I don’t know what vii is doing there; arguably it should have been filtered out.
Next I’ll look at the size of the topic. There are two ways of looking at this, and since I’m going to be using them a lot, it’s worthwhile going over them at some length.
The model assigns each article a probability of being in each topic. So for each article there is a topic with maximal probability. (In principle there could be ties, but in practice that doesn’t seem to happen.) I’ll follow a fairly standard practice and say that an article is in a topic if that topic has maximal probability. And then the number of articles in a topic is the number of articles such that this topic gets higher probability for that article than any other topic. These can be counted up to get a sense of the size of the topic.
Number of Articles: 398
Percentage of Total: 1.2%
Rank: 32nd
There are 398 articles that are in early modern in this sense). That’s slightly more than average, since there are about 360 articles in the average topic. It’s 1.2 percent of the total; as can be calculated, the average topic would have 1.1 percent. And if the topics are ordered from largest to smallest, it makes Early Modern the thirty-second largest of the topics.
But this isn’t the only way to measure the size of a topic. The model gives a probability of being in early Mmodern to every article in the data set. Those probabilities can be added up to get another way to measure topic size. Formally, this is the way to calculate the expected number of articles in that topic given the probability distribution, though I don’t believe thinking of these numbers as expected values is particularly helpful. If that is done, summing the probabilities of being in early modern across all articles, the following statistics are retrieved:
Weighted Number of Articles: 292.2
Percentage of Total: 0.9%
Rank: 49th
I’ll call this calculation the weighted number of articles in the topic. As I said, mathematically it’s just the formula for expected value calculation, but I’m going to use it more like a weighted sum, hence the name. By this measure, early modern looks a little smaller. It’s now only the forty-ninth largest topic, and is under 1 percent. This is one of the larger gaps between the two ways of measuring the size of a topic; mostly they go together. (Though there is going to be one special case where they come dramatically apart.)
Next I’ll look at some facts about the dates of articles in that topic.
Mean Publication Year: 1960.5
Weighted Mean Publication Year: 1959.5
Median Publication Year: 1963
Modal Publication Year: 1981
The first, third and fourth statistics there are easy to understand. I simply took the 398 articles in early modern, and found the mean, median and modal publication dates for them. The second is only a little trickier. I calculated the weighted average of the publication year of all articles in the data set, where the weights are given by the probability of being in early modern. As happens here, the first three numbers usually end up being very similar. The fourth can be quite random and usually leans toward the present since there are more articles published now than in the past.
The last statistics I’ll look at, before going on to some graphs, concern how close early modern is to various neighbours. I’ll present these then explain them.
Topic with Most Overlap: Idealism (0.0463)
Topic this Overlaps Most with: Ontological Argument (0.0214)
Topic with Least Overlap: Formal Epistemology (3e-04)
Topic this Overlaps Least with: Game Theory (0.00011)
Recall that each of the 398 articles in early modern is also assigned a probability of being in each of the other eighty-nine topics. I then calculated the average probability of being in each of the eighty-nine topics among these 398 articles. And the first line here reports that the highest average probability was for idealism. It isn’t huge—just 4.6 percent, but given I’m only looking at nonmaximal probabilities, and it’s a ninety-way partition, this isn’t that small. The third line reports that the lowest of these average probabilities was for formal epistemology. Usually there is a group of ten to twenty topics that have vanishingly small mean probabilities here and it’s a bit random which of them the model picks out.
Each of the other topics could also be looked through and ask, Of the articles in those topics, what is the average probability the model gives to them being early modern articles? And which topic is such that this average is highest? If this is done to all eighty-nine calculations, it turns out the answer is the topic about the ontological argument. This is one of the smaller topics, but the articles in it have on average a probability of just over 2 percent of being early modern articles. On the other hand, the articles in game theory have a mean probability of being early modern articles of only 0.01 percent. I suspect this is because the model separates out early modern from social contract theory, and any paper on the intersection of seventeenth-/eighteenth-century philosophy with game theory ends up classified as a social contract paper.
That’s enough statistics to get started. I will move on to some nice graphs. First, I’ll show the proportion of articles that are in that topic in each year. I’m using weighted sums for this. So really what each point here shows is the average probability that an article in this year is in this topic.
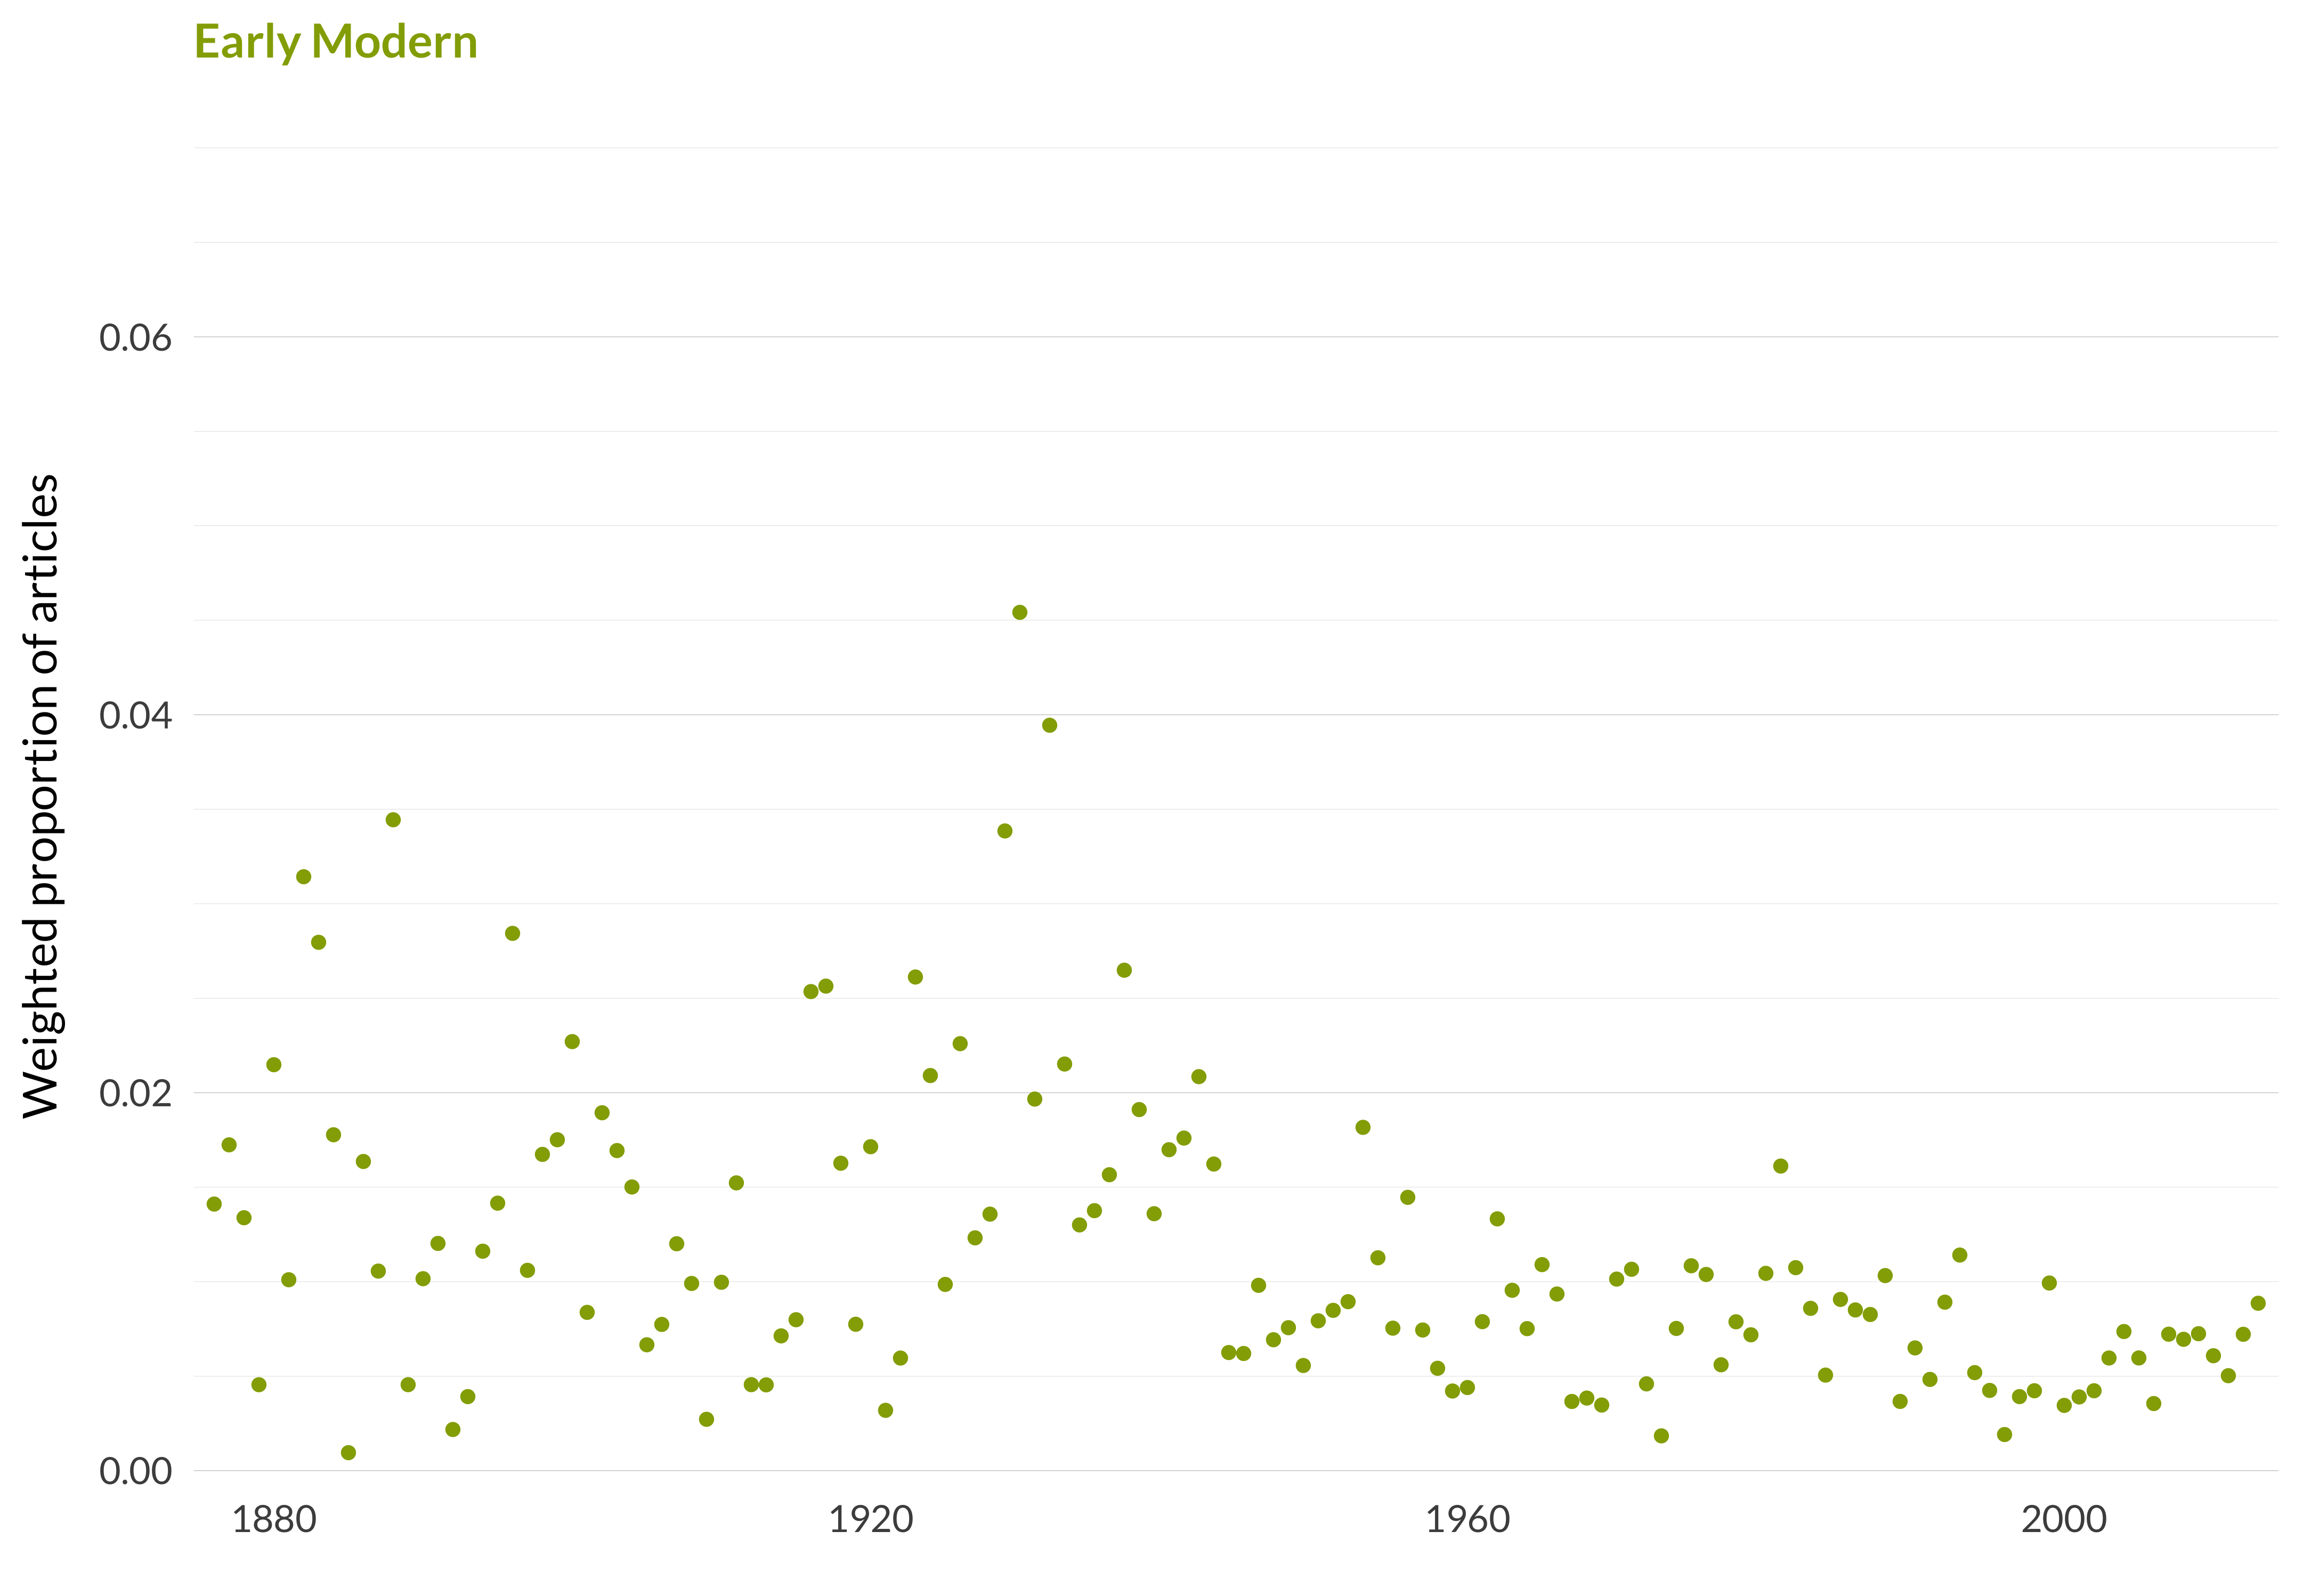
Figure 2.1: Early modern
Next, I’ll do the same thing but broken down by journals.
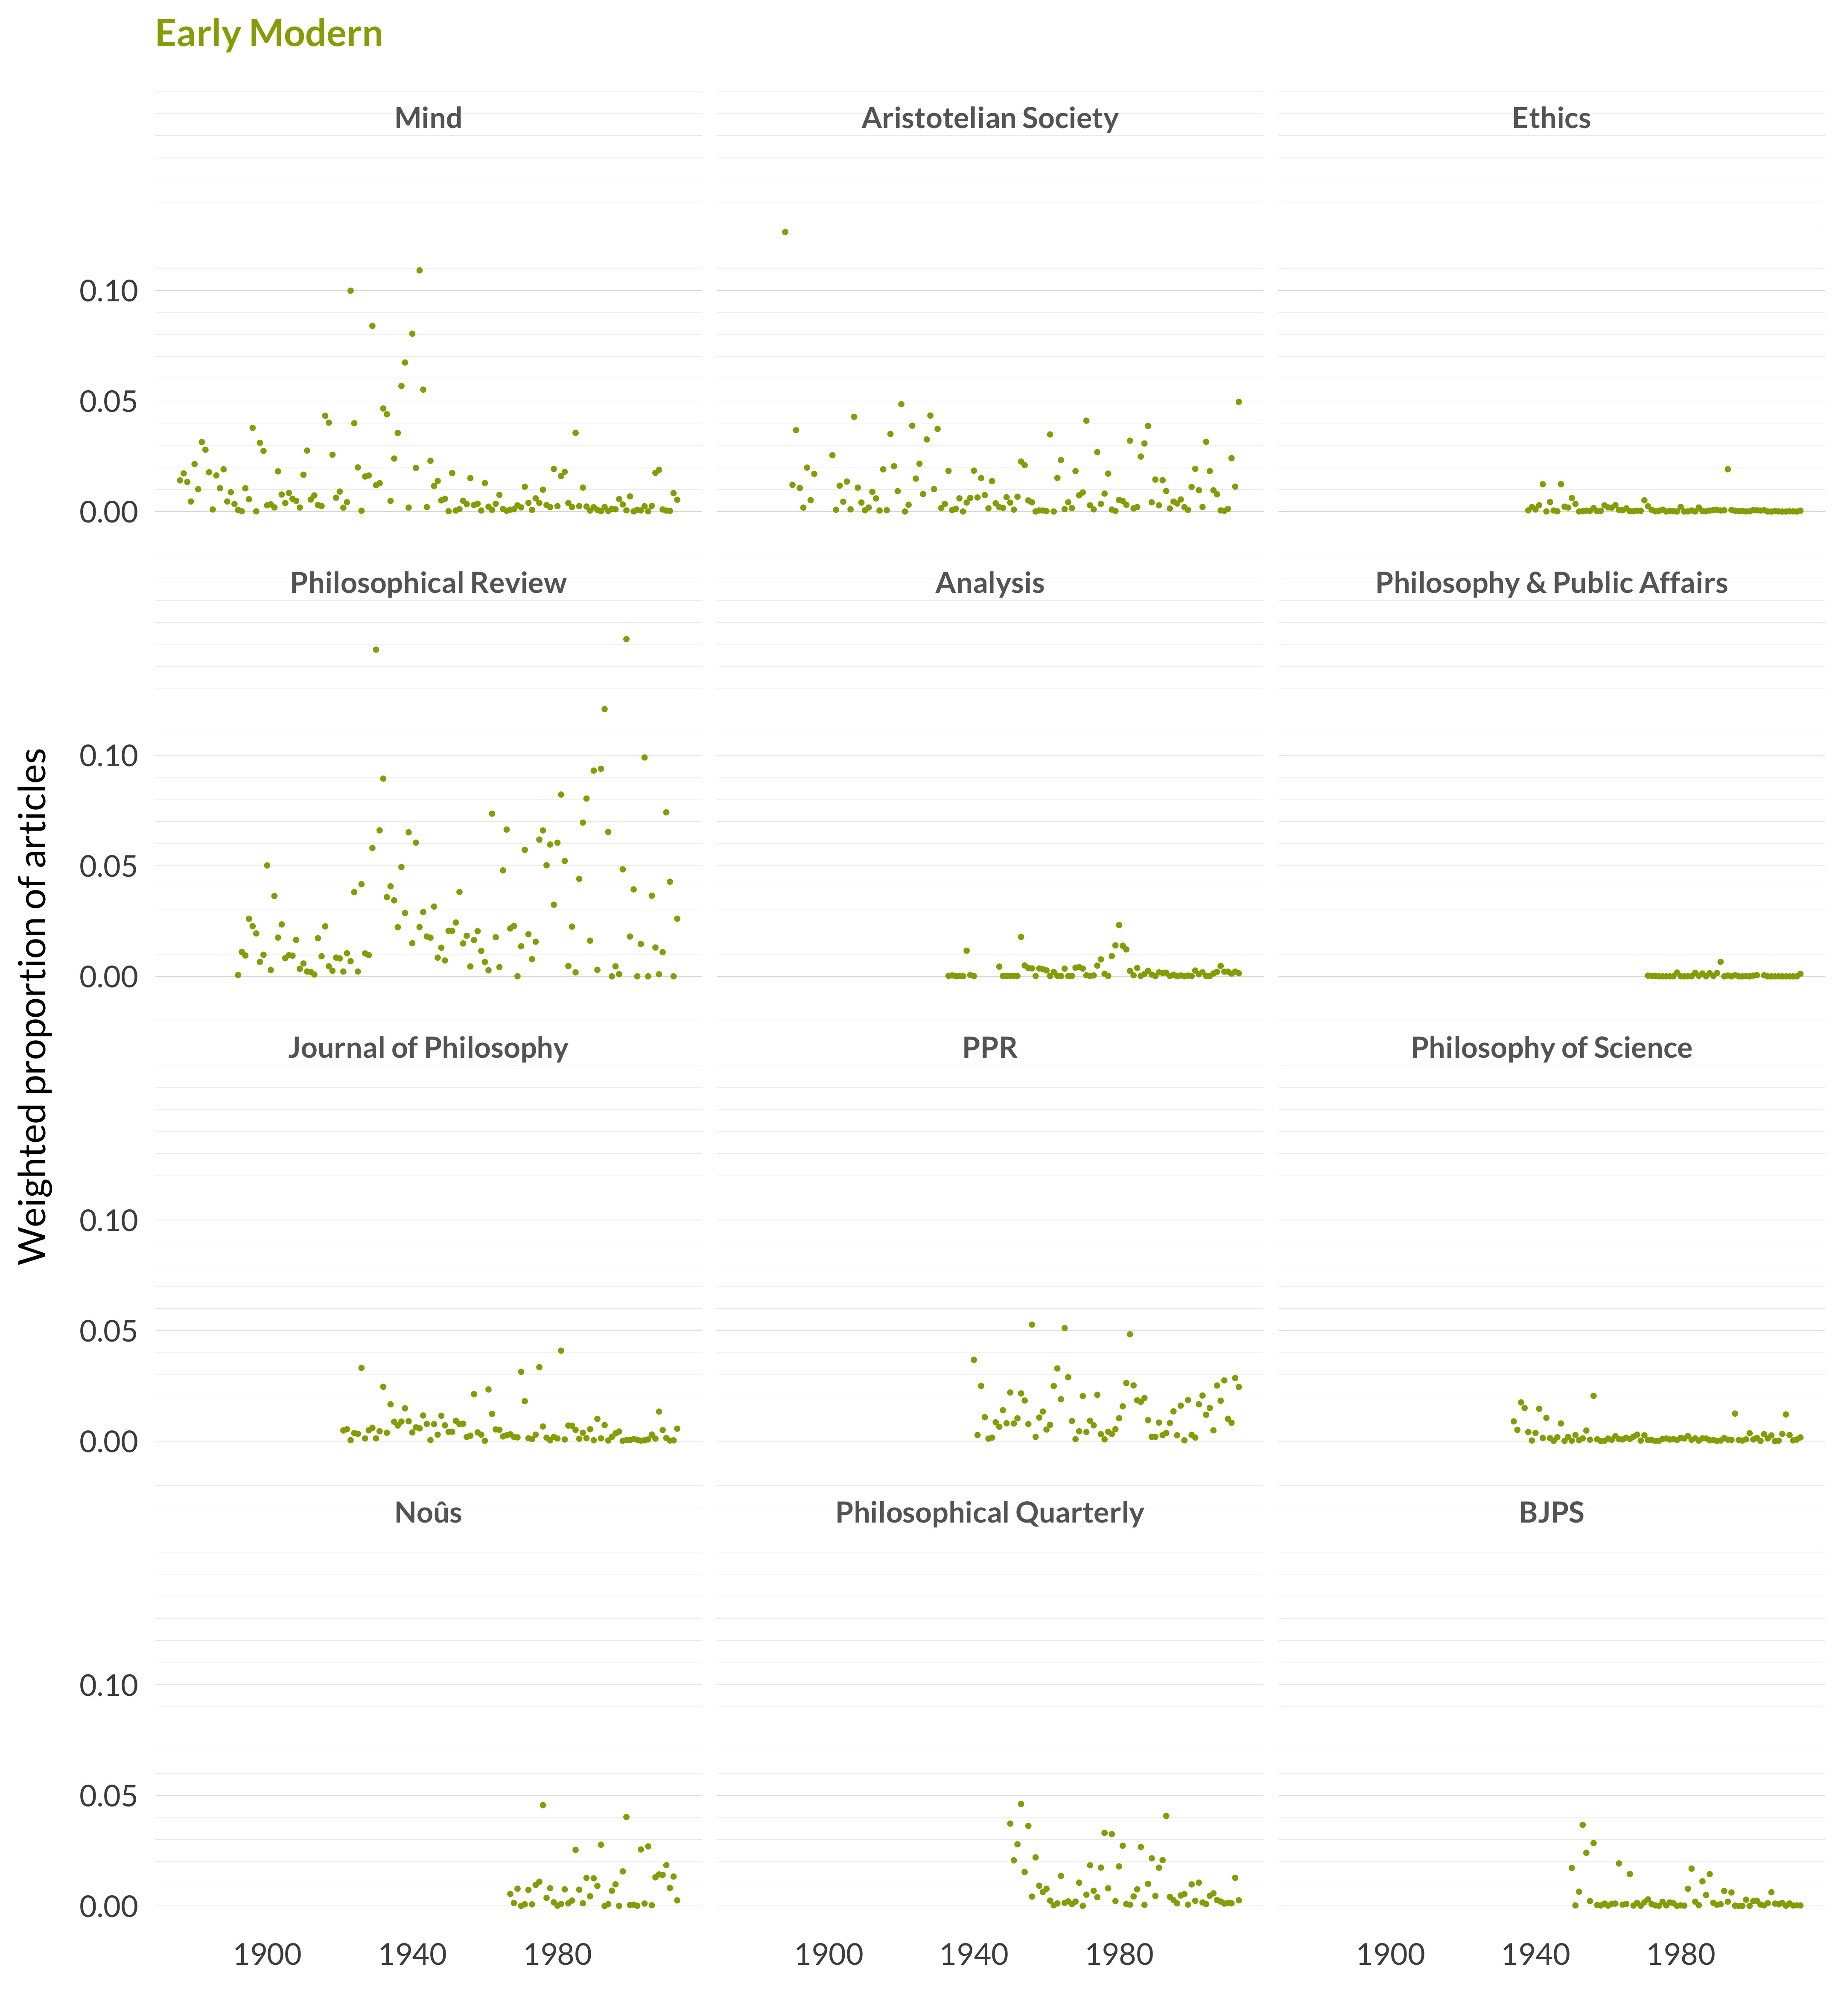
Figure 2.2: Early modern articles in each journal
As you can see, this has years on the x axis, and ratios on the y axis, and twelve “facets”. What each dot represents is an average probability for an article in a particular year-journal pair being located in this topic. It helps to understand what this means by working through an example.
Look in the facet for Philosophical Review. There are two dots that are much higher than the rest, both of them around 0.15. The left-hand one, which is just under 0.15, is from the early 1930s. The right-hand one, just over 0.15, is from 1999. And I’m going to talk through this one for a bit. Here are the eleven articles in Philosophical Review that year, along with their probability of being in topic 21.10
| Article | Probability of Being Early Modern |
|---|---|
| Ned Block and Robert Stalnaker, 1999, “Conceptual Analysis, Dualism, and the Explanatory Gap,” Philosophical Review 108:1–46. | 0.0000059 |
| Mohan Matthen, 1999, “The Disunity of Color,” Philosophical Review 108:47–84. | 0.0000078 |
| Sigrun Svavarsdottir, 1999, “Moral Cognitivism and Motivation,” Philosophical Review 108:161–219. | 0.0000041 |
| Dugald Murdoch, 1999, “The Cartesian Circle,” Philosophical Review 108:221–44. | 0.5994303 |
| R. C. Sleigh, Jr., 1999, “Leibniz on Freedom and Necessity: Critical Notice of Robert Adams, Leibniz: Determinist, Theist, and Idealist,” Philosophical Review 108:245–77. | 0.3953824 |
| Michael V. Griffin, 1999, “Leibniz on God’s Knowledge of Counterfactuals,” Philosophical Review 108:317–43. | 0.2185809 |
| Patricia Kitcher, 1999, “Kant on Self-Consciousness,” Philosophical Review 108:345–86. | 0.0386547 |
| Kai Draper, 1999, “Disappointment, Sadness, and Death,” Philosophical Review 108:387–414. | 0.0000102 |
| Michael Jacovides, 1999, “Locke’s Resemblance Theses,” Philosophical Review 108:461–96. | 0.4234606 |
| Katalin Balog, 1999, “Conceivability, Possibility, and the Mind-Body Problem,” Philosophical Review 108:497–528. | 0.0000096 |
| J. David Velleman, 1999, “A Rational Superego,” Philosophical Review 108:529–58. | 0.0016148 |
If these eleven probabilities are summed, the answer 1.6771613. And dividing by eleven to get the average, the answer is 0.1524692. And that’s where the dot I was pointing out comes from.
Note that this might feel a little light. Topic 21 is, more or less, early modern metaphysics and epistemology. And that looks like it should be three or four out of the eleven topics, which is much more than 0.15. What’s going on?
One thing that’s happened is somewhat inevitable when dealing with history. The article by Michael Griffin (1999) is definitely about Leibniz, which is why a probability well above 0 is seen, but it’s also about modals and counterfactuals. And there is another topic that’s all about modality, so a bunch of the probability went there. (Indeed, it is officially in that topic because that probability was maximal.) And it’s about God, and there are two topics about God in the model, and some of the probability went there. This is the general case. History of philosophy articles involve a lot of philosophy, and whatever kind of philosophy they involve, the model will want to put them with other philosophy articles discussing those points.
But how does that explain the article by Dugald Murdoch (1999)? Surely that’s an early modern article. And it surely is. The simplest thing to say there is that when there are ninety exclusive hypotheses, ending up with a probability of 0.6 for one of them is actually a lot. And some of the remaining probability also makes sense. There is a topic for the ontological argument, and some of the probability for Murdoch’s article goes there. And there is a topic on arguments, and the articles in that topic are mostly about how to understand circularity, so some of the probability goes there. And there is a topic for ordinary language philosophy, and most articles use some ordinary language, and hence are given a non-trivial probability of being in it. That topic causes some complications, because it’s as much a style as a topic, and I’ll come back to it a lot in what follows.
In essence, that’s how the facet graphs are constructed. Apart from the Mind facet, the graphs do not start all the way to the left edge, because those journals didn’t start publishing until after Mind did. The color of the dots is taken from the color the topic has in the big graphs done later when all ninety topics are presented on one graph. I need to add a few words about the scale of these graphs. There were two competing considerations when setting the scale. On the one hand, it would be good to have the scale of the Y-axis be the same for all topics. That way, when flipping through the pages, there is an immediate visual sense of how big the topic is. On the other hand, that approach forces us to set the scale to accommodate outliers. And if that is done, the vast majority of the graphs are just dots that bounce on or just above the x axis.
To deal with both these concerns, I’ve split the difference somewhat. On the one hand, the vast majority of the overall graphs—the ones that show the prevalence of the topic across all journals—are set to a common scale. I’ve adjusted the scale a little for the really big topics, such as idealism and ordinary language philosophy, but mostly the scale is the same. On the other hand, the scales for the graphs that break things up by journal vary a lot. So, when trying to get a quick visual impression from the graphs, the first graph says something about the size of the topic, and the second graph says something about the distribution of the topic over the journals. But the second graph doesn’t say, unless one looks closely at the labeling on the y axis, how big the topic is in each journal.
I have made one other visual note to help read the graphs. The gridlines in each graph are at the same places. Therefore, if the scale is increased for a large topic, there will be lots of gridlines in the background, and that’s a sign that it’s a bigger topic as well. I’m not sure this is an ideal solution, but it seemed less bad than the others I tried.
After these graphs, there are two tables of the articles that are in the topic. Here is the first:
This table actually lists all 398 articles in early modern. By default it displays ten at a time. It’s possible to move through the list by the numbers at the bottom, or extend it using the dropdown menu in the top left.
The search box in the upper right will search for any text in the citation. This is helpful either for finding title words (e.g., Spinoza), or author names (e.g., Curley).
The year and citation columns are self-explanatory. The probability column gives the probability that the article is actually in early modern. This is helpful to check when finding an article that looks misclassified. If the number is under about 0.25, that means the model is fairly undecided about what to do with the article, and it ended up here for want of somewhere better to put it.
The table is sortable by any of those three columns. But its default sort order is by what I’ll call typicality. This is the product of its probability of being in the topic, with the log of its length in pages. I’m using this complicated formula because for most topics, the high-probability articles are short discussion notes where the model doesn’t see anything to offset its initial judgment about where the article should go. Using this (totally made up) typicality measure as the initial sort meant that the articles that turned up here were more familiar and gave me a better sense of what was, well, typical for the topic.
The second table is a list of highly cited articles in the topic.
I used “Publish or Perish” (Harzing 2007) to download the fifty most cited articles from each of the twelve journals according to Google Scholar. I do not stand by these lists as being particularly accurate. I tried a couple of obvious ways to download the data, and they had obvious shortcomings, which I corrected. And then I thought the lists I had were good enough for illustrative purposes, so I stopped. But there were so many obvious things to correct that I’m sure there were also nonobvious things to correct. But the point is not to do a citation study; it’s to list some familiar articles that are in the topic.
The order of this list is most to least Google Scholar citations. Note that it is not the six hundred most cited articles in the twelve journals; the fiftieth most cited Journal of Philosophy article is cited more than practically any Philosophical Quarterly article. 11 But again, the point is not to measure how well cited the topics are; it’s to list some familiar articles in the topics. And I felt that spreading around the journals was best for that purpose.
Google Scholar isn’t particularly reliable at distinguishing between articles with the same title, year, and publication venue. So there is the occasional doubling up as with the two Spitzer articles that are the highly cited articles here. As I said, I don’t stand behind the accuracy of these lists; they are there to illustrate the topic.
Some very low probabilities turning up in these tables will be noticeable. Note that the first of the two Spitzer articles only has a probability of being in early modern of about 0.21. But that’s higher than its probability of being in any other topic. Sometimes the most influential articles in philosophy are ones that don’t neatly fit into one topic or another. Indeed, one of the themes of this book is that by highlighting where the most work has been done, it’s possible to see more clearly what areas are left open. They’ll probably be the areas that produce highly cited articles of the next 138 years.
More carefully, for any word \(w\) and model \(t_k\) the model provides something like \(\Pr(w | t_k)\), the probability of a word turning up in an article in that topic. I’m looking for the words that maximize \(\frac{\Pr(w | t_k)}{\sum \Pr(w | t_i)}\), where the sum is over the ninety topics, and the constraint is that the average value of \(\Pr(w | t_i)\) is at least \(\frac{1}{20000}\).↩︎
The automatically generated citations include messy things like “Sleighjr”, and I just haven’t corrected them - I’m just going with what JSTOR feeds me.↩︎
With one notable exception.↩︎