2.64 Sense and Reference
Category: Philosophy of Language
Keywords: quotation, referential, referent, kaplan, referring, tokens, token, demonstrative, verb, verbs, descriptions, noun, indexical, singular, semantically
Number of Articles: 368
Percentage of Total: 1.1%
Rank: 40th
Weighted Number of Articles: 340.3
Percentage of Total: 1.1%
Rank: 37th
Mean Publication Year: 1986.4
Weighted Mean Publication Year: 1982.8
Median Publication Year: 1987
Modal Publication Year: 1998
Topic with Most Overlap: Ordinary Language (0.047)
Topic this Overlaps Most With: Belief Ascriptions (0.0543)
Topic with Least Overlap: Social Contract Theory (0.00032)
Topic this Overlaps Least With: Life and Value (0.00037)
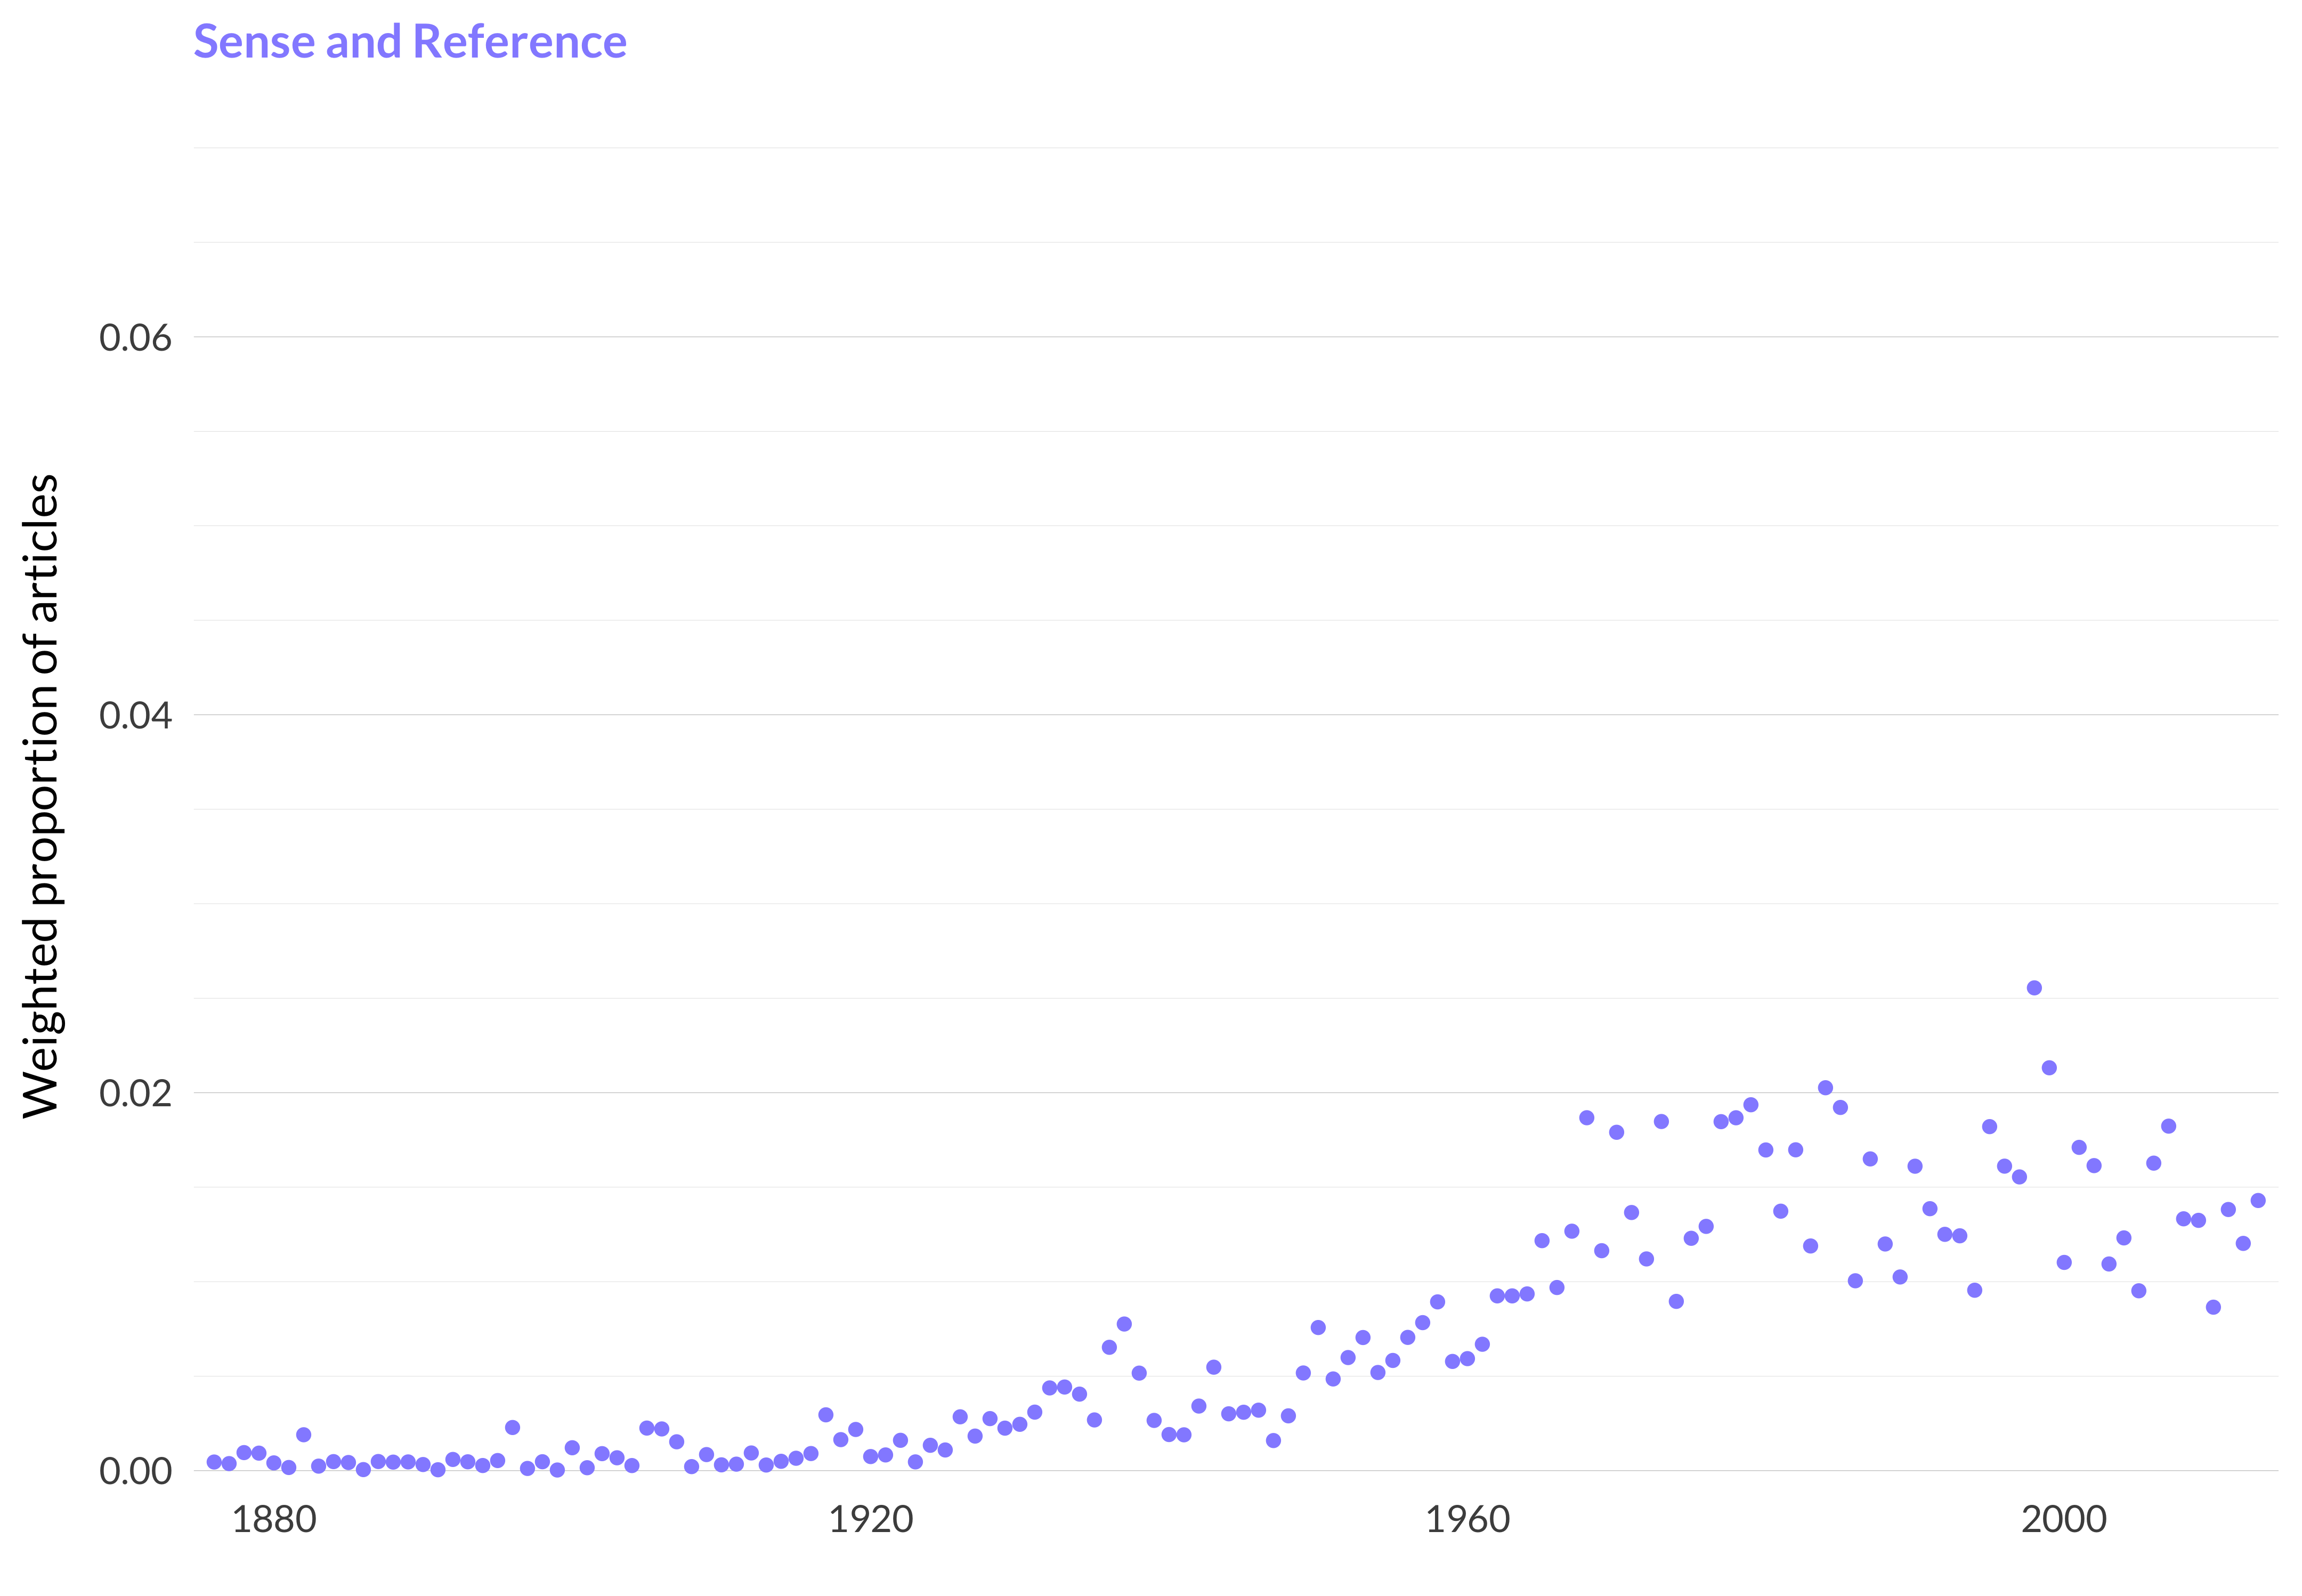
Figure 2.148: Sense and reference.
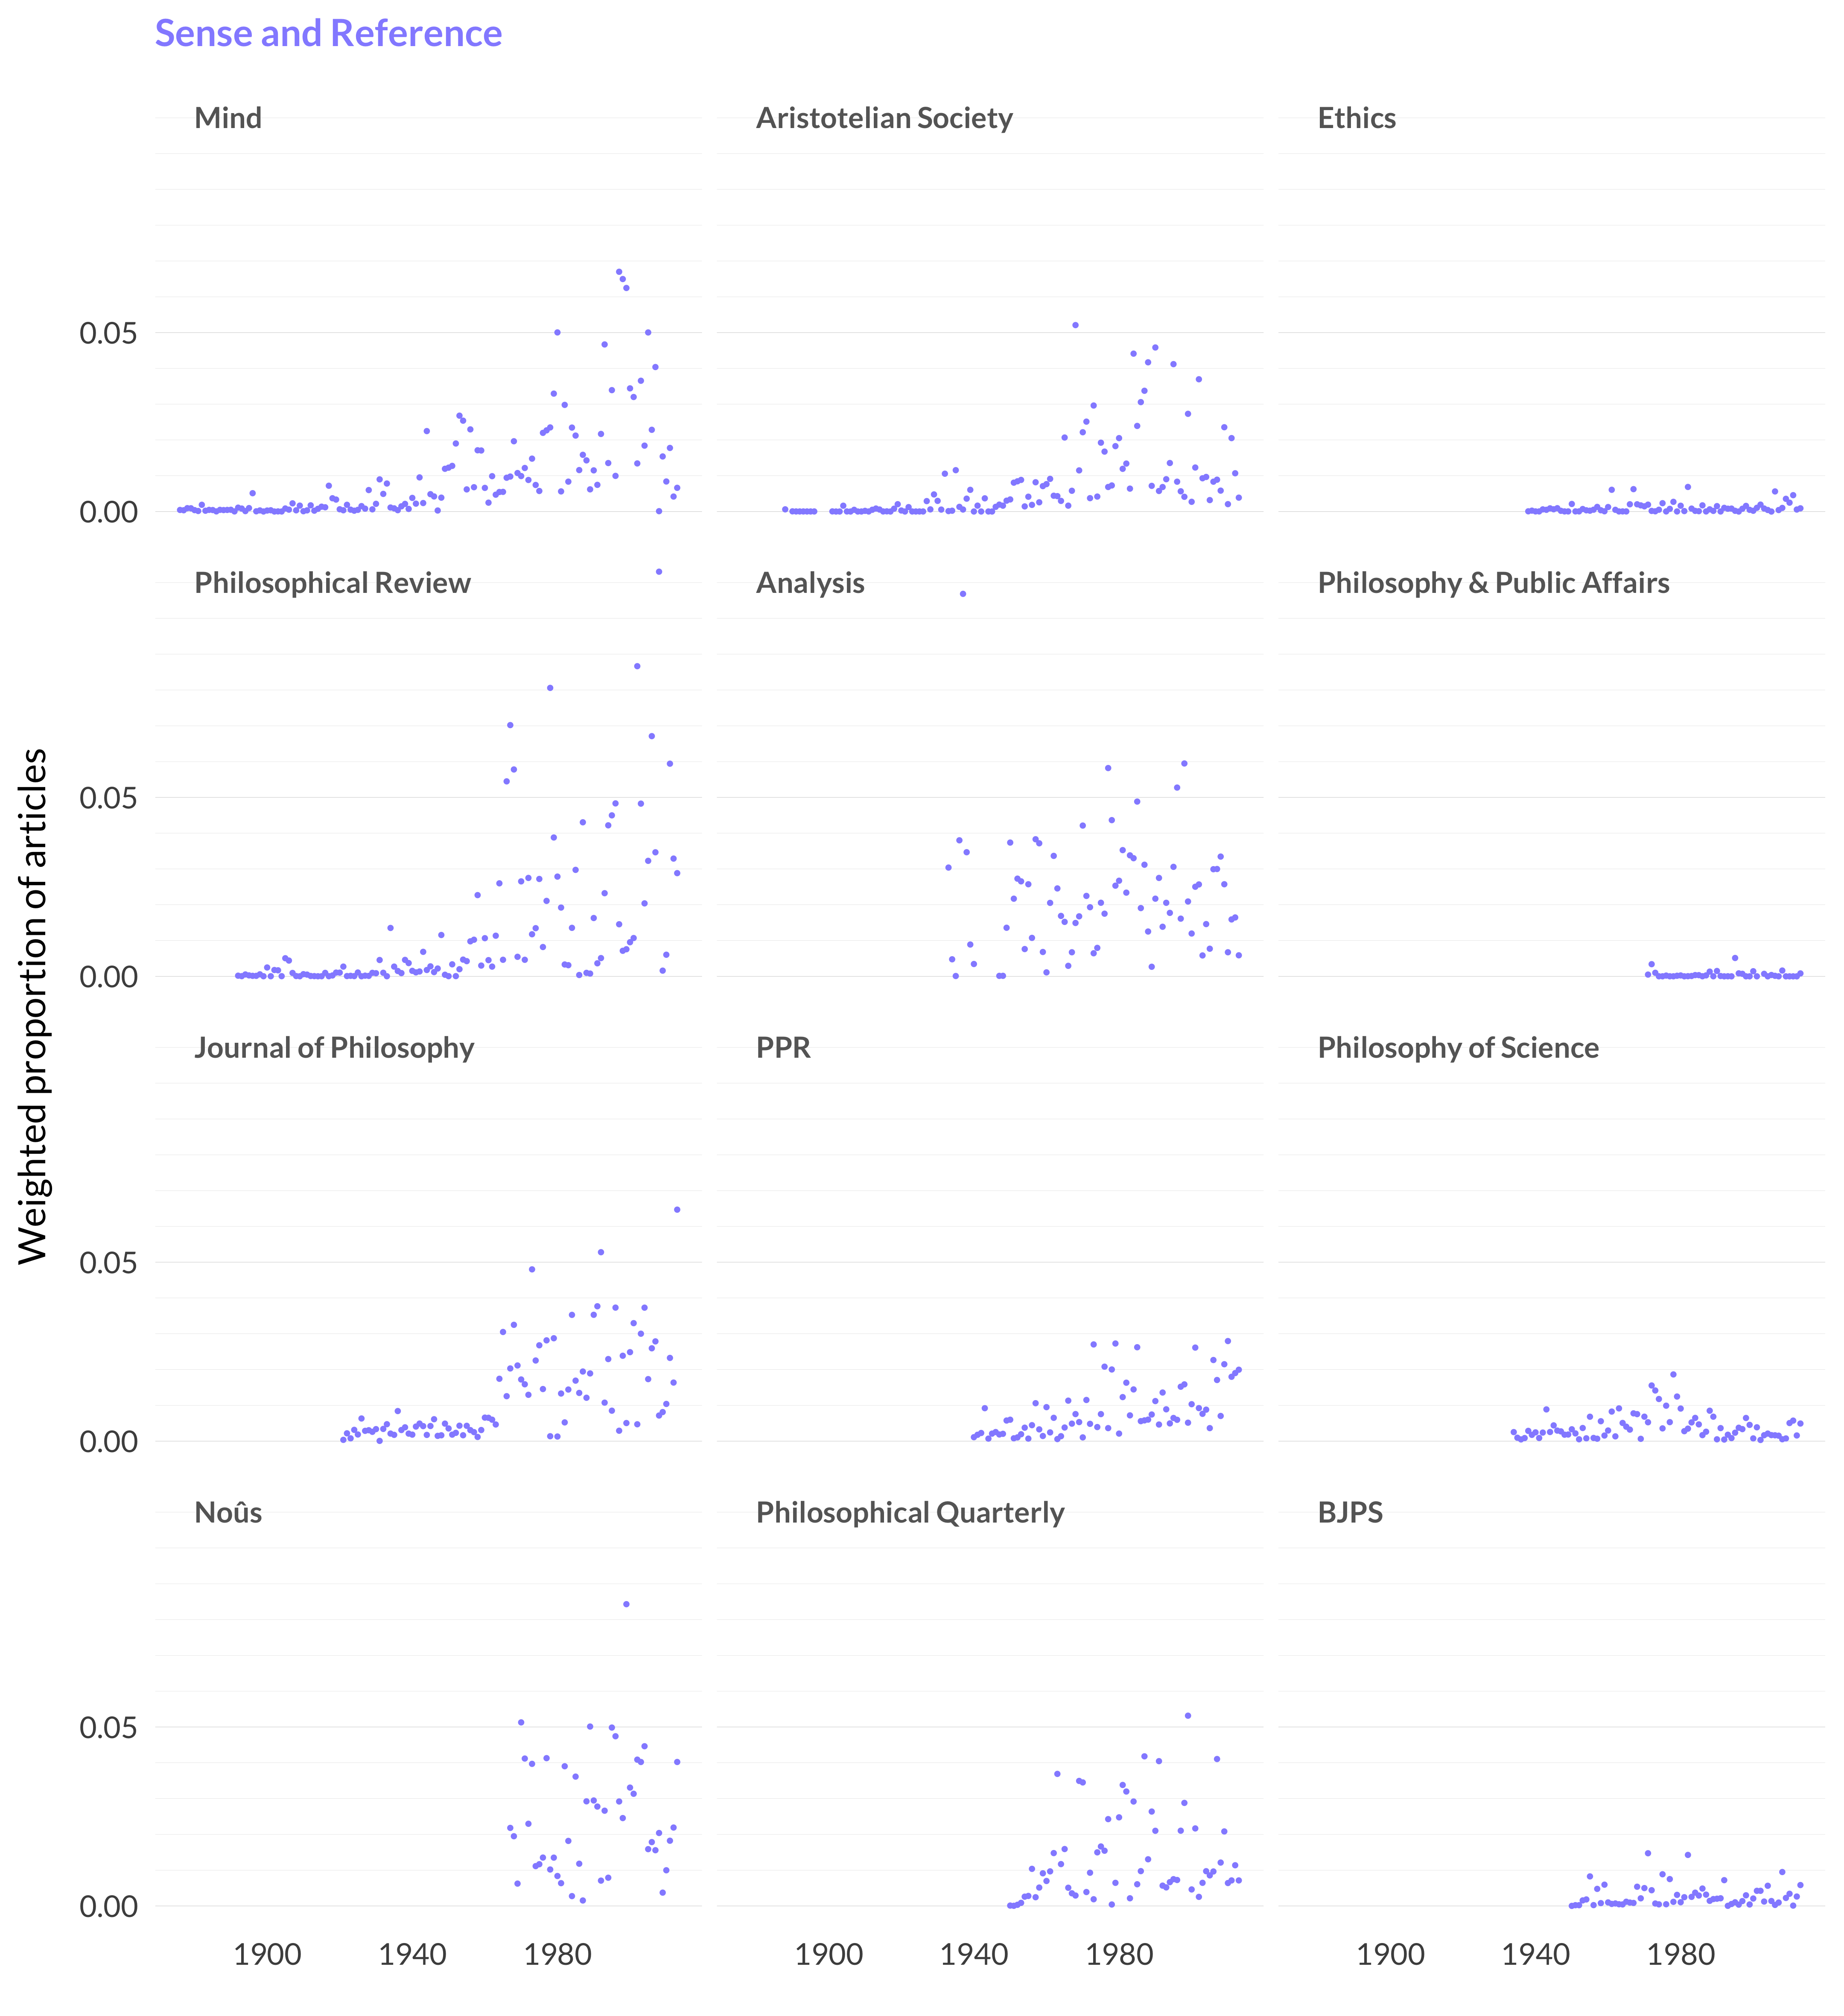
Figure 2.149: Sense and reference articles in each journal.
Comments
The model is carving things up a little more finely than may be ideal here, so let’s put some stuff back together. This topic obviously has a lot to do with denoting and with belief ascriptions. And it’s useful to see all three of these on a single graph.
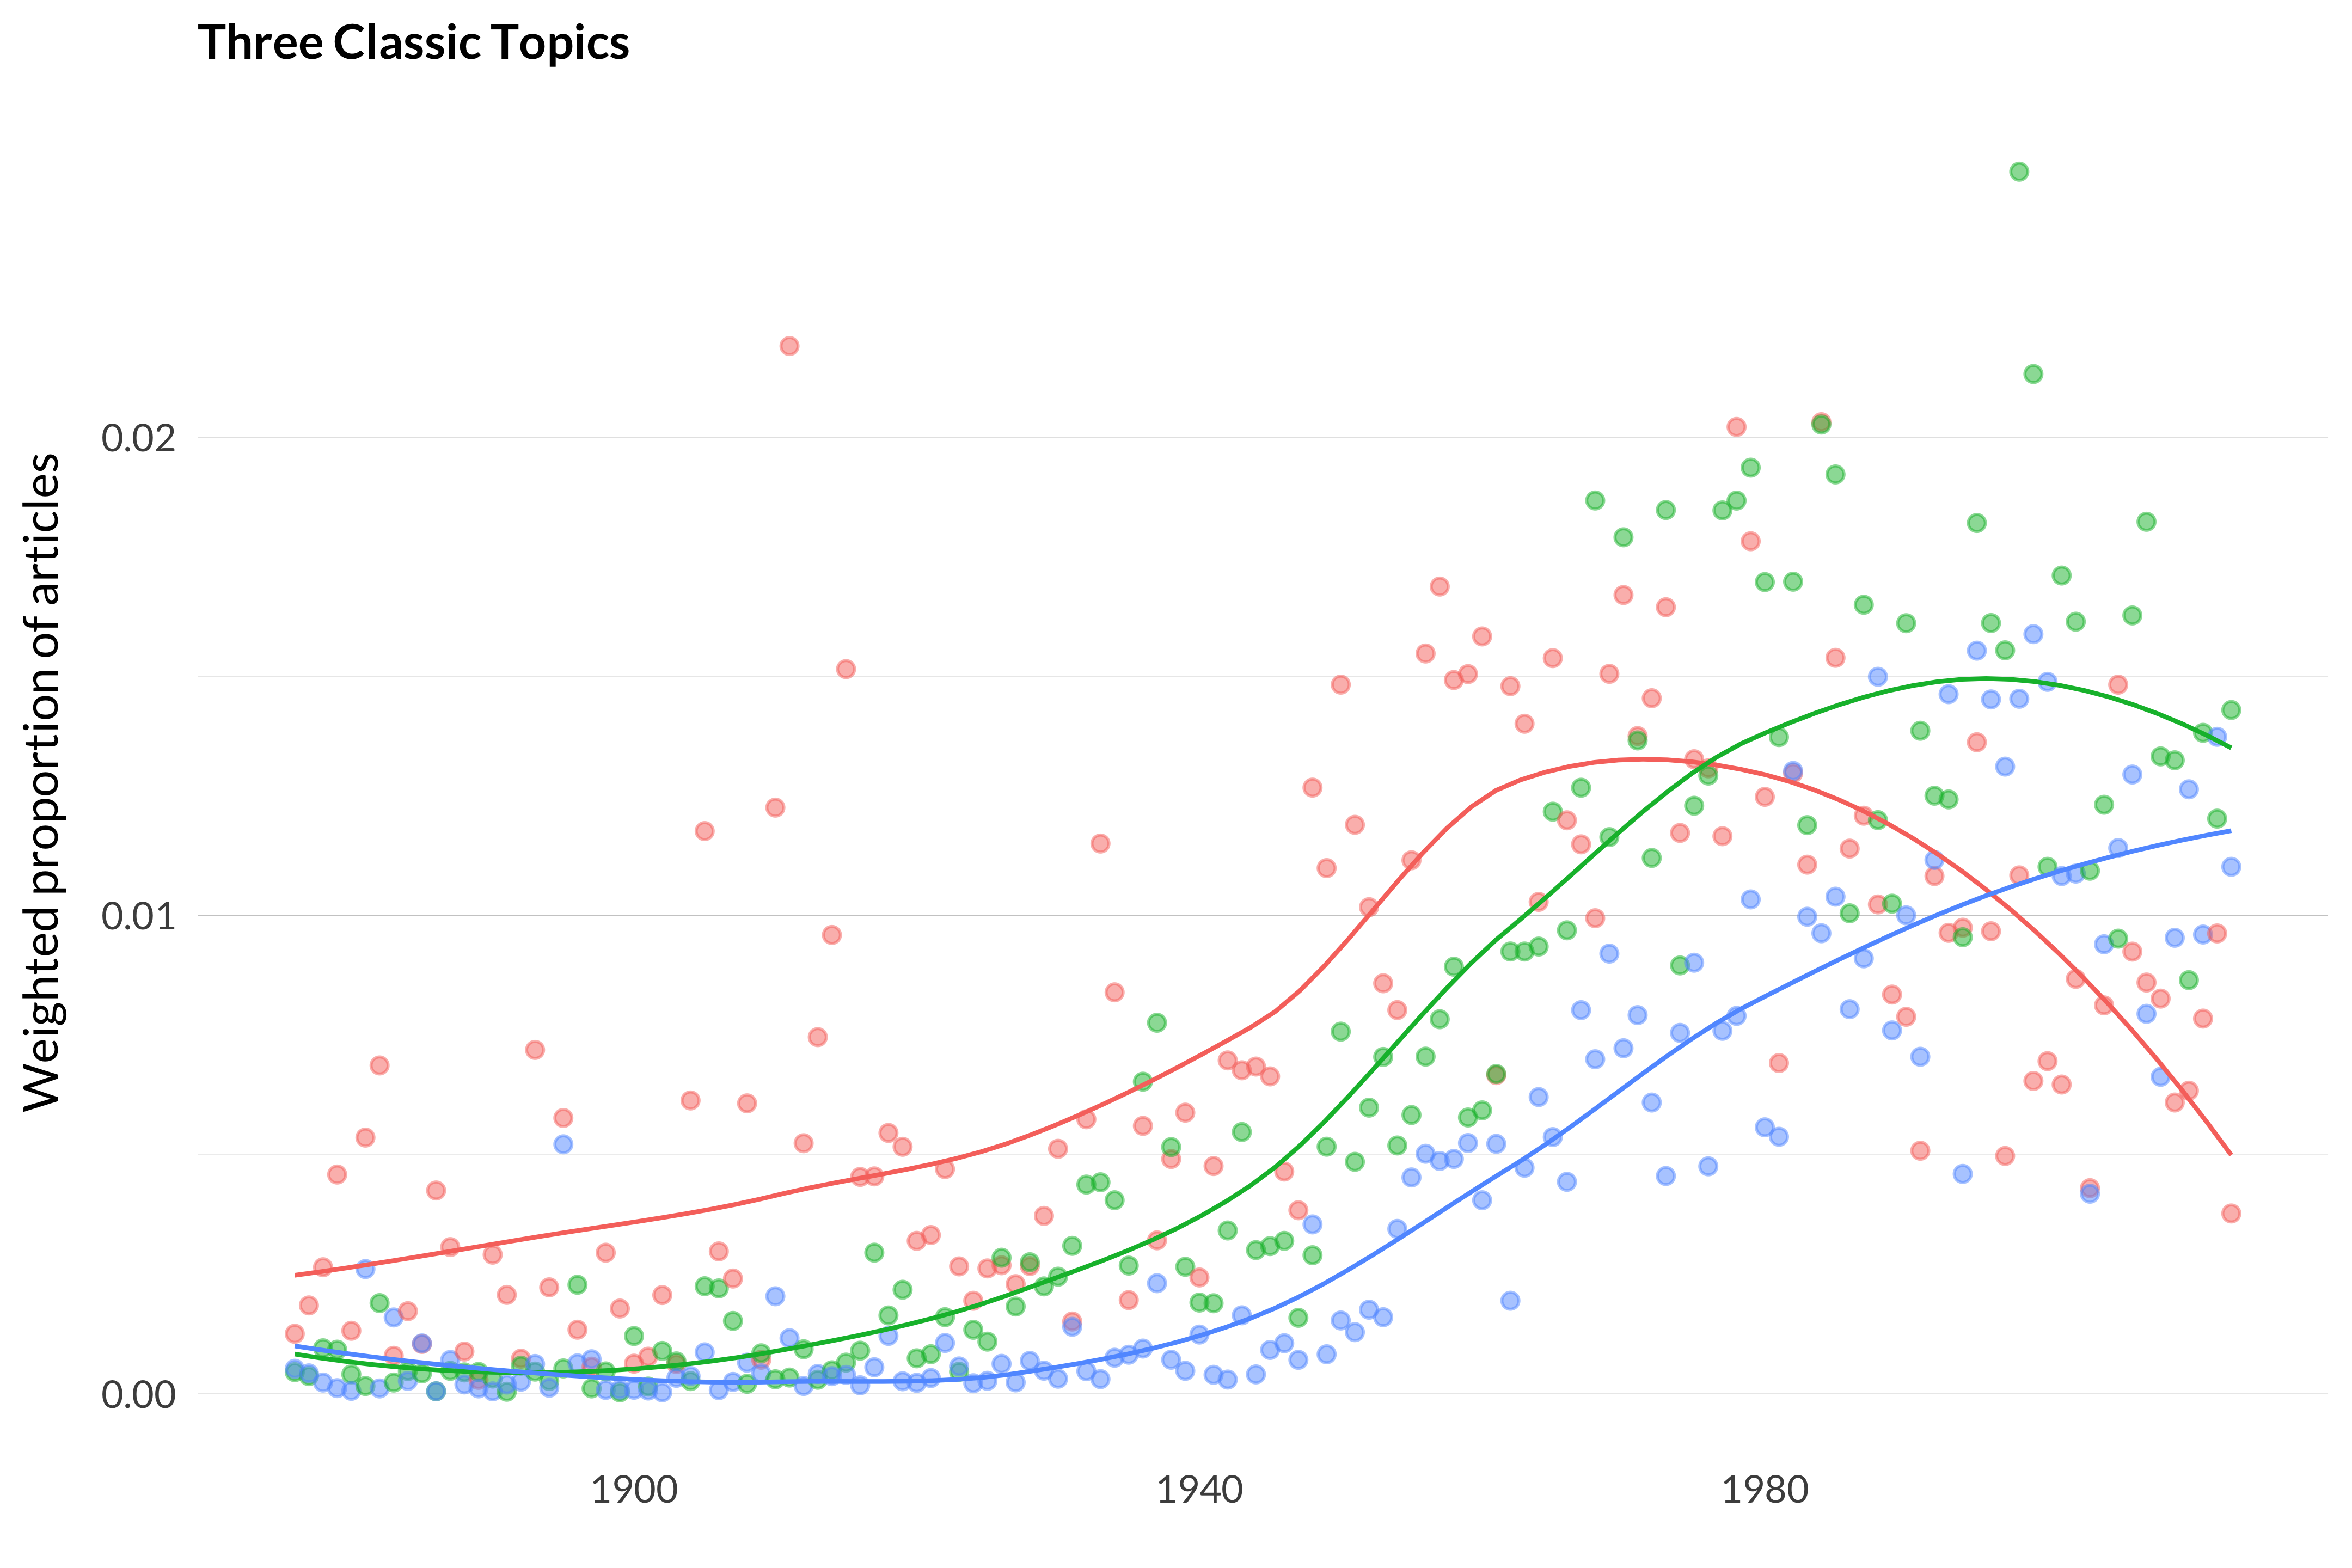
Figure 2.150: Relative frequency of denoting, sense and reference, and belief ascriptions
There is a tiny amount of discussion of these three, mostly focussed on descriptions, up until World War II. Then they all start to take off. But descriptions as such starts to fade quite early, with its peak being the late 1970s. Some of that is just substitution—there is a lot of discussion of how descriptions work in articles on sense and reference, and articles on belief ascriptions. But the sum seems to be headed a little downwards as we move into the twenty-first century, and I’d expect that gentle trend continues through 2020.
Even at their peak, these topics don’t take up as much space in the journals as they take up in philosophers’ self-representation. At most these topics are coming to about 3–4 ercent of the discussion over any sustained period of time. But during that time they were routinely taking up more than 3—4 percent of space in graduate education. (For instance, it was not unusual to have compulsory first-year seminars largely about these topics.) My feeling is that the journals got this right and the departments got this wrong, and 3–4 percent was a sensible proportion of space to devote to these topics. That said, it was surprising to me that this never went much higher than that; it certainly felt at times like more than 3–4 percent of the discussion was devoted to denotation, sense, reference and opaque contexts.