Iron catalytic nanoparticle formation
![]()
![]() ME574(W13) TEAM 4
ME574(W13) TEAM 4
Result
With the matlab code, we changed experiment condition
such as annealing temperature and initial thickness of thin film.
1) Here is the formation of Iron
particle at 800 ⁰C from 1nm thick film.
Inside the animation, the curve shows x-y coordination (1nm scale) of
each node. Each frame (0.15 sec) presents one time step (dt*=10-3) of simulation and we consider
that the formation of iron particle is completed when the sum square of x-y
coordination changes of all nodes are less than 10-8.

2) This curve
shows the running time to complete the formation depending on the different annealing temperature.

The running time of particle formation is exponentially decreased as the
temperature increases in the range of 750 ⁰C to 800 ⁰C.
Note that the formation at 750 ⁰C has not converged to the circle
although the “Change” value is less than 10-8. Therefore
we set this value as 10-9 in this case. This modification is
reasonable because the surface moves significantly slow in the lower
temperature region.
Click for animation (at 750 ⁰C), x5 speed.
Click for animation (at 850 ⁰C), x1 speed.
3) The
following animation shows the iron particle formation depending on the
different initial thickness of film layer; 2nm and 3nm. (The animation is fast-forwarded with 10x
speed)
Click for animation (2nm thick
film)
Click for animation (3nm thick
film)
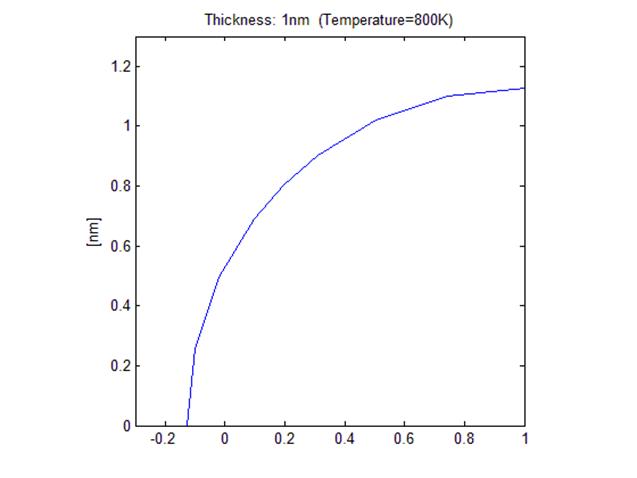
Regardless of the initial thickness, the final surface has converged to the quadrant which has the final radius according to the conservation of volume as follow;

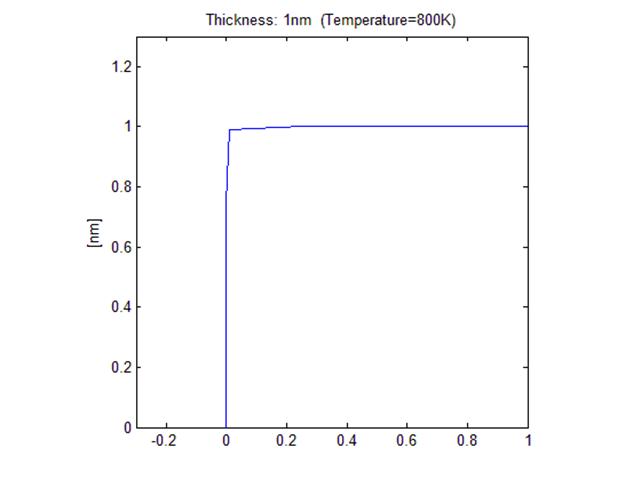
< Initial
shape with 1nm thick film>
<Final shape after annealing, R ~ 1.13 nm >


< Initial shape with 2nm thick film> <Final shape after annealing,
R ~ 1.59 nm>

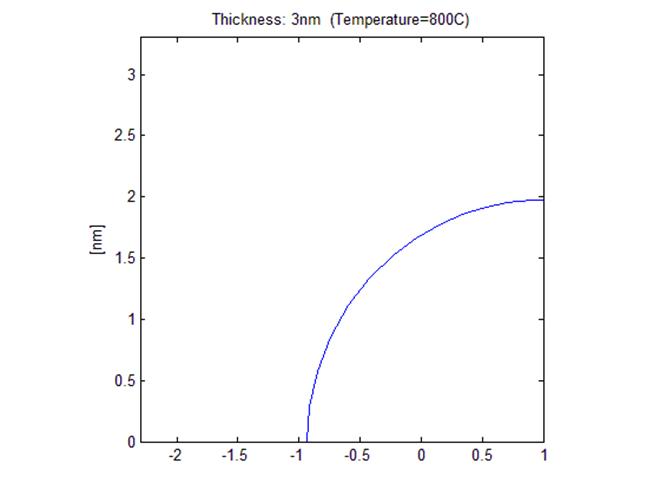
< Initial shape
with 3nm thick film>
<Final shape after annealing, R ~ 1.95 nm >