4.5 Logic and Mathematics

Twelve scatterplots showing which percentage of the articles in each journal in each year are in the category logic and mathematics. A brief summary of the data follows. In an average year in Mind, 16.9% of the articles are in the category logic and mathematics. Logic and mathematics is most prevalent in Mind in 1994 when it accounts for 36.1% of the articles in the journal. And it is least prevalent in 1884 when it accounts for 2.8% of the articles in the journal. In an average year in Proceedings of the Aristotelian Society, 10.7% of the articles are in the category logic and mathematics. Logic and mathematics is most prevalent in Proceedings of the Aristotelian Society in 1959 when it accounts for 24.1% of the articles in the journal. And it is least prevalent in 1891 when it accounts for 2.6% of the articles in the journal. In an average year in Ethics, 3.2% of the articles are in the category logic and mathematics. Logic and mathematics is most prevalent in Ethics in 1958 when it accounts for 8.0% of the articles in the journal. And it is least prevalent in 1999 when it accounts for 0.6% of the articles in the journal. In an average year in Philosophical Review, 10.5% of the articles are in the category logic and mathematics. Logic and mathematics is most prevalent in Philosophical Review in 1954 when it accounts for 26.8% of the articles in the journal. And it is least prevalent in 1892 when it accounts for 2.6% of the articles in the journal. In an average year in Analysis, 21.7% of the articles are in the category logic and mathematics. Logic and mathematics is most prevalent in Analysis in 1933 when it accounts for 52.7% of the articles in the journal. And it is least prevalent in 1991 when it accounts for 8.7% of the articles in the journal. In an average year in Philosophy and Public Affairs, 1.2% of the articles are in the category logic and mathematics. Logic and mathematics is most prevalent in Philosophy and Public Affairs in 1979 when it accounts for 2.1% of the articles in the journal. And it is least prevalent in 2013 when it accounts for 0.3% of the articles in the journal. In an average year in Journal of Philosophy, 12.6% of the articles are in the category logic and mathematics. Logic and mathematics is most prevalent in Journal of Philosophy in 1949 when it accounts for 22.1% of the articles in the journal. And it is least prevalent in 1994 when it accounts for 3.7% of the articles in the journal. In an average year in Philosophy and Phenomenological Research, 10.8% of the articles are in the category logic and mathematics. Logic and mathematics is most prevalent in Philosophy and Phenomenological Research in 1944 when it accounts for 21.6% of the articles in the journal. And it is least prevalent in 2010 when it accounts for 4.9% of the articles in the journal. In an average year in Philosophy of Science, 12.8% of the articles are in the category logic and mathematics. Logic and mathematics is most prevalent in Philosophy of Science in 1936 when it accounts for 29.8% of the articles in the journal. And it is least prevalent in 2008 when it accounts for 2.9% of the articles in the journal. In an average year in Noûs, 15.3% of the articles are in the category logic and mathematics. Logic and mathematics is most prevalent in Noûs in 1969 when it accounts for 34.8% of the articles in the journal. And it is least prevalent in 1990 when it accounts for 6.6% of the articles in the journal. In an average year in The Philosophical Quarterly, 11.0% of the articles are in the category logic and mathematics. Logic and mathematics is most prevalent in The Philosophical Quarterly in 2004 when it accounts for 22.0% of the articles in the journal. And it is least prevalent in 1950 when it accounts for 1.6% of the articles in the journal. In an average year in British Journal for the Philosophy of Science, 11.1% of the articles are in the category logic and mathematics. Logic and mathematics is most prevalent in British Journal for the Philosophy of Science in 1963 when it accounts for 23.4% of the articles in the journal. And it is least prevalent in 1992 when it accounts for 3.5% of the articles in the journal.

Figure 4.12: Proportion of each journal’s yearly publications in logic and mathematics.

The story of this category is a rise until midcentury and a fall afterwards. The journals start to give us a few clues as to what happened.

  • Analysis starts off being very welcoming to logic and mathematics—so much so that it messes up the scales for these graphs a bit—but gets progressively less so over time.
  • Noûs follows the same pattern.
  • Mind under Hamlyn really stops doing any of this kind of work, though it returns in a hurry once Hamlyn leaves.
  • Philosophy of Science moves strongly away from doing logic and mathematics work. And given the number of papers Philosophy of Science publishes in the 1990s and 2000s, this affects the numbers a lot.

So part of the story here, perhaps a large part, is a familiar refrain. The specialist journals are getting more specialist, and this is crowding out other things. But the downward trajectory in Analysis and Noûs matters too. Let’s look by topics.

10 scatterplots showing which percentage of the articles in all journals in each year from 1900 onwards are in the each of the topics category logic and mathematics. A brief summary of the data follows. In an average year, 0.8% of the articles are in the analytic/synthetictopic. Analytic/synthetic is most prevalent in 1949 when it accounts for 2.5% of the articles in all journals. In an average year, 1.6% of the articles are in the deductiontopic. Deduction is most prevalent in 1914 when it accounts for 6.0% of the articles in all journals. In an average year, 1.9% of the articles are in the definitionstopic. Definitions is most prevalent in 1934 when it accounts for 5.2% of the articles in all journals. In an average year, 1.0% of the articles are in the mathematicstopic. Mathematics is most prevalent in 1912 when it accounts for 2.5% of the articles in all journals. In an average year, 1.7% of the articles are in the propositions and implicationstopic. Propositions and implications is most prevalent in 1905 when it accounts for 5.6% of the articles in all journals. In an average year, 0.8% of the articles are in the setstopic. Sets is most prevalent in 1905 when it accounts for 2.7% of the articles in all journals. In an average year, 1.5% of the articles are in the truthtopic. Truth is most prevalent in 2002 when it accounts for 3.8% of the articles in all journals. In an average year, 1.4% of the articles are in the universals and particularstopic. Universals and particulars is most prevalent in 1933 when it accounts for 3.6% of the articles in all journals. In an average year, 0.6% of the articles are in the vaguenesstopic. Vagueness is most prevalent in 2005 when it accounts for 2.1% of the articles in all journals. In an average year, 1.5% of the articles are in the verificationtopic. Verification is most prevalent in 1950 when it accounts for 4.5% of the articles in all journals.

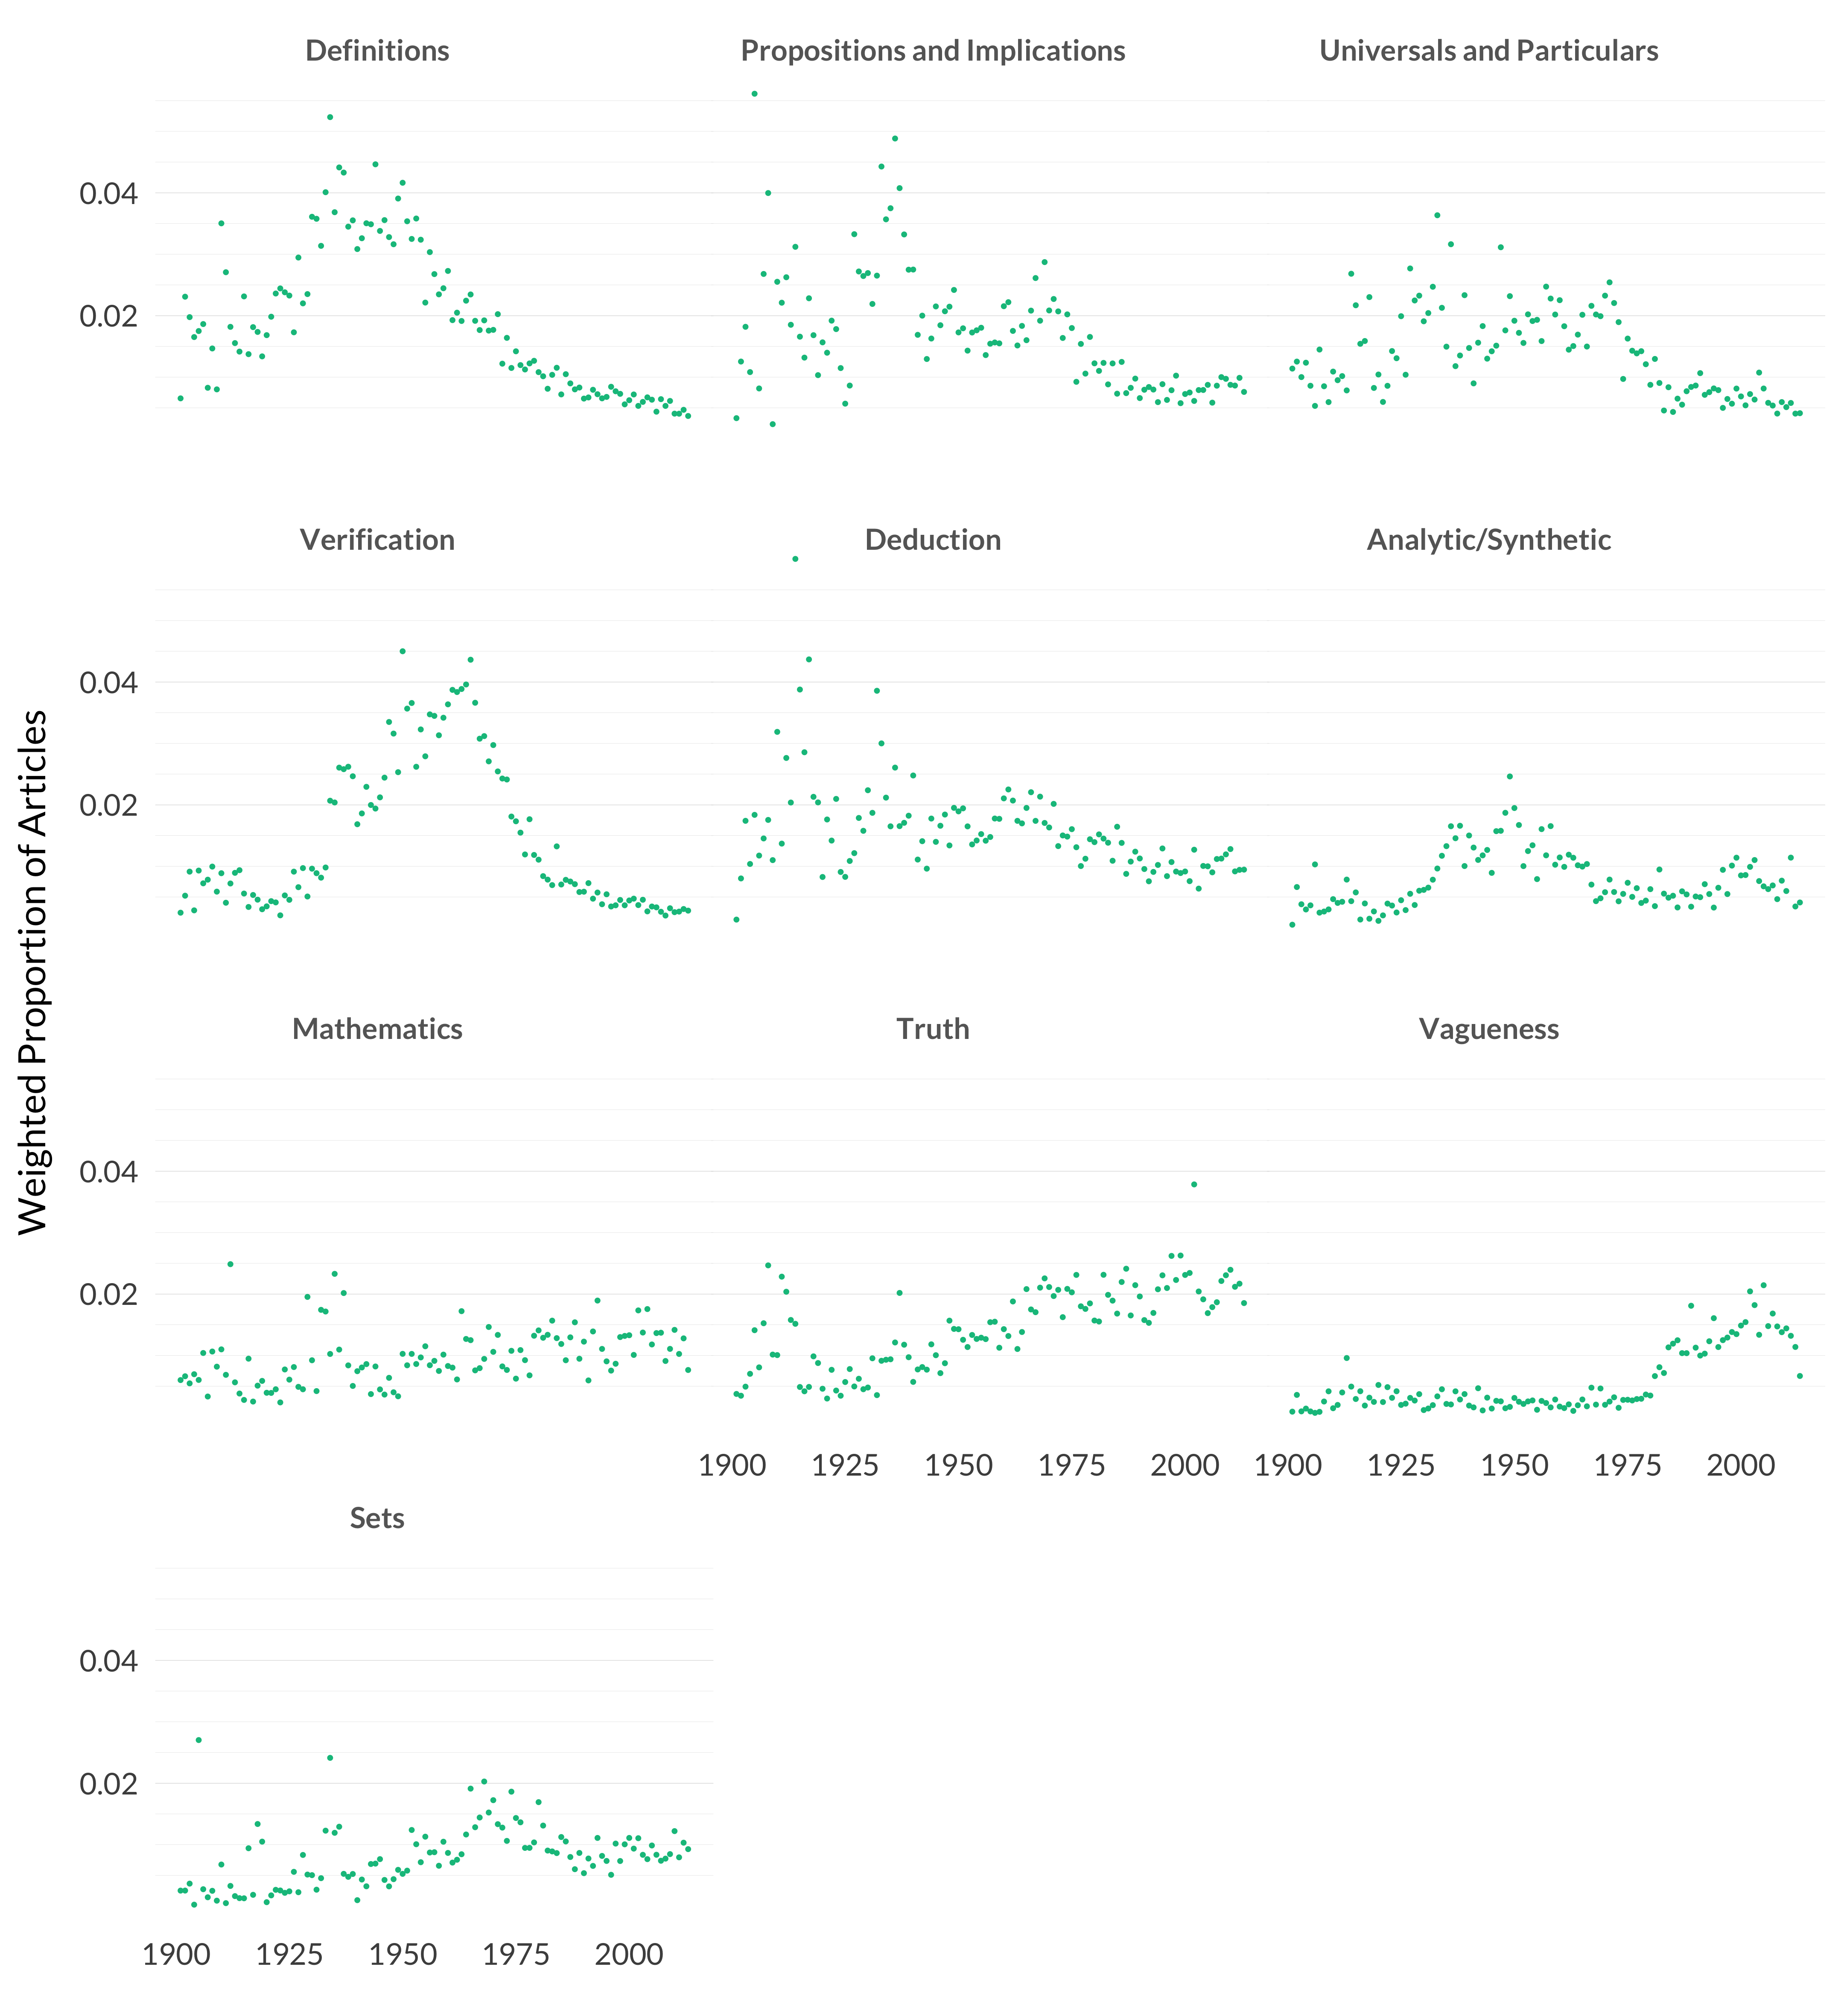
Figure 4.13: Topics in Logic and Mathematics

That makes a bit clearer what happened. Two topics associated with positivism—definitions and verification—are in the category. And they peaked in midcentury and then fell.

They peaked at slightly different times, which I wouldn’t have expected. I guess a lot of the work in definitions is really trying to make positivism work, by getting a working account of definitions. And once verification itself becomes a topic, it’s because people are starting to think that the verification principle doesn’t have a defensible disambiguation. It’s not so much logic fell away, as that logical positivism did. And we knew that would happen.

It’s only up to 2 percent, but there is an interestingly steady rise in work on theories of truth. These play an important role in contemporary theories of logic, especially in motivating nonclassical theories. The optimistic take on this category is that the topics that have fallen are now basically at 0, so they can’t fall farther, while other topics are steadily rising. I’m not sure I buy that—I suspect we’ll see more falls if we extend this study beyond 2013—but it’s one reason for optimism.