
| Home |
| Basic Theory and Weak Statement |
| Computational Design |
| Matlab Methods |
| Results |
Results
Here we have the results of the simulation for two scenarios. In one simulation, we just used a single nucleation site where we have one particle grow on the substrate. In the other simulation, we began with two nucleation sites that grew and merged into a single film. Seen below are the outcomes of both simulations.
Results for a Single Nucleation Site (Matlab code can be downloaded here)
|
||
| One Site Nucleation Simulation Video |
||
| Here, the video shows a 2D finite element simulation of thin film growth by vapor deposition. The simulation assumes that the film grows as a product of condensation on a substrate. Film growth is initiated at one user defined nucleation site and the boundary conditions set on the system so that the end nodes can only travel in the x direction, thus confining them to the surface of the substrate.
In this video γ, surface tension, is assumed to be 0.2 while the free energy densities, gI and gII, are set to 1 and 0.2, respectively. See code for other values.
|
||
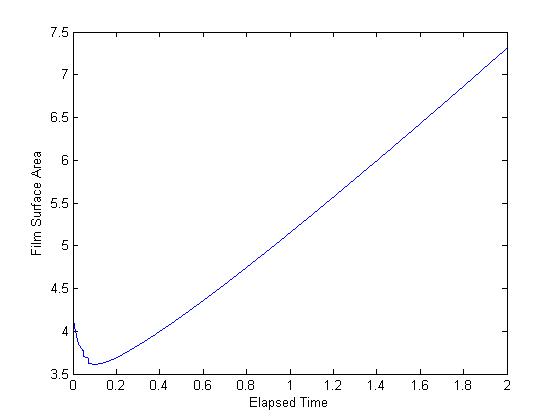 |
Surface Area versus Time |
|
| This graph shows how the surface area evolves over the elapsed time. Note that the surface area in the context of this 2D simulation is the arclength of the interface surface of the particle. Besides the initial transients the surface area increases at a steady rate as one would expect. |
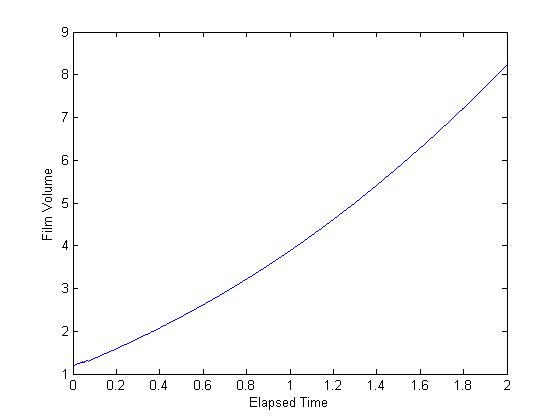 |
Volume versus Time |
|
| This graph shows how the volume of the particle evolves over the elapsed time. Note that the volume in the context of this 2D simulation is the area under the curve of the particle interface surface.
The increase in volume is a steady increase as time moves forward.
|
Results for two Nucleation Sites (Matlab code can be downloaded here)
|
||
| Two Site Nucleation Simulation Video |
||
| Here, the video shows a 2D finite element simulation of thin film growth by vapor deposition. The simulation assumes that the film grows as a product of condensation on a substrate. Film growth is initiated at two user defined nucleation sites and the boundary conditions set on the system so that the end nodes can only travel in the x direction, thus confining them to the surface of the substrate. In this simulation, you will notice how the two particles grow and then merge into one surface.
In this video γ, surface tension, is assumed to be 0.2 while the free energy densities, gI and gII, are set to 1 and 0.2, respectively. See code for other values.
|
||
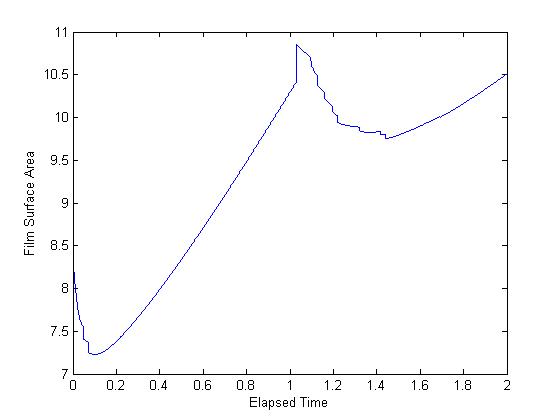 |
Surface Area versus Time |
|
| This graph shows how the surface area evolves over the elapsed time. Note that the surface area in the context of this 2D simulation is the arclength of the interface surface of the particle. Up to the midpoint of the elapsed time, the increase in surface area is similar to that of the single nucleation site case. At the midpoint though,
we notice a sudden decrease in surface area. This happens once the two particles merge resulting in a loss of surface area as the particles are merging. Once they merge, the growth starts to increase again and become a steady increase.
|
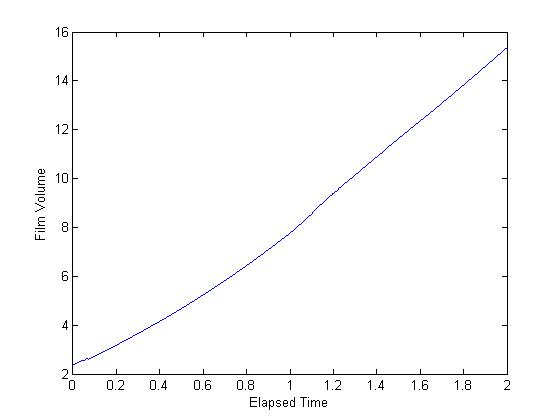 |
Volume versus Time | |
| This graph shows how the volume of the particle evolves over the elapsed time. Note that the volume in the context of this 2D simulation is the area under the curve of the particle interface surface.
Again, up to the midpoint the volume increase is steady and similar to the growth behavior of the single particle case. At the midpoint we notice a "kink" in the curve, representing the transients that occur when the particles merge, afterwards the growth become steady once again.
|