Central Campus Air Quality Model (CCAQM) Instructions
Central Campus Map
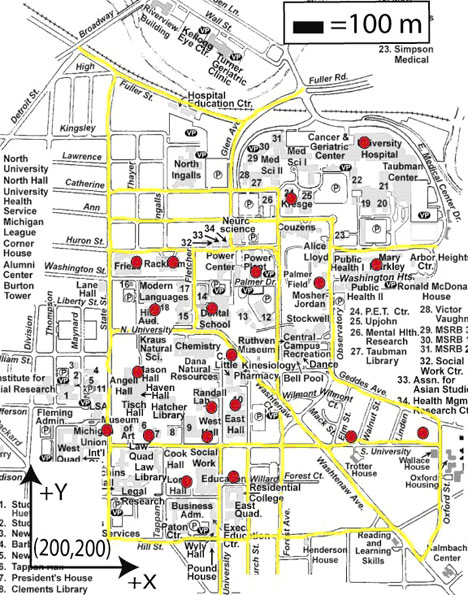
In the map of the
University of Michigan central campus (below), the yellow lines
indicate the network of line sources (roads), and red dots represent
locations of pollution receptors of interest.