Job/task factors
Describe job/task deliverables -- quantity, quality, and time.
Work quantity, e.g.,
- Install 8 connectors per 30s cycle
- Install 2 hoses (4 connections) per 1min cycle
- Wash 150 place seetings (plates, bowels, glasses, cups and silverware) per hour
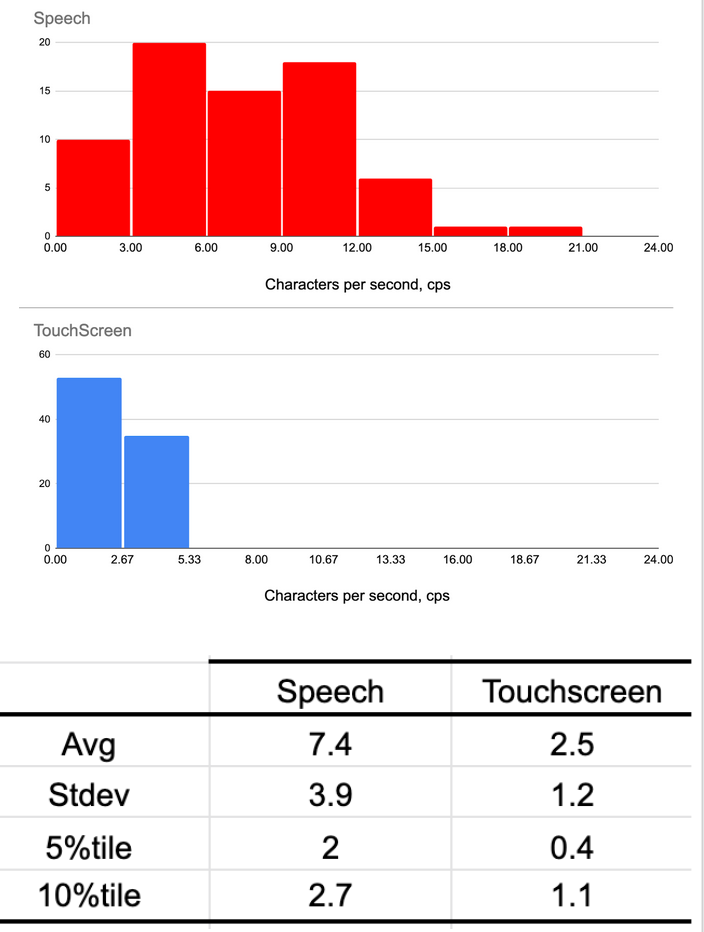
- Send 50 charater text message within 1 minute
- Administer defibrillation using an AED within 4 minutes
- Adminiser 15 vaccinations per hour
- Deliver mail to 200 residences
Work Quality, e.g.,
- Install all connectors and check continuity
- Connect hoses and check for leaks
- Install fastener to specified torque
- Wash, rinse and sanitize dishes
- Send text message without ambiguity errors
- Deliver correct mail to residences and get correct signatures as required
Information that provides guidance for completion of the job/task or information or hardware that becomes a part of or a byproduct of the job/task deliverable.
Physical Marterials
- Examples
- parts
- Ingredients
- Food
- Chemicals
- Medications
- Patient
- Important attributes
- Size, wieght, quanity, containers, presentation/order,
- Consistency
- Temperature
- Condition
Electronic materials
- Examples
- Financial data
- Tax data
- instructions
- Correspondence
- Medical data/records
- Software
- Important attributes
- Complexity
- Organization
- Format
- Quantity
Mechanical
- Examples:
- Workbench/table
- Conveyor
- Handtool (powered or unpowered)
- Important attributes affecting Performance
- Major dimensions
- Weight, reaction forces
- Handles
- Control placement, action
- Maintenance, servicability
Software
- Examples
- Operating systems
- Word processor -- copy, cut, past, format, etc. tools
- Spdeliversheet -- functions, plots, etc.
- CAD program -- line, rectangle, extrude, dimension, etc. Tools
- Important attributes
- Menu structures
- Screen Organization
- Shortcuts & scripts
- Inputs: keyboard, mouse, voice, etc.
- Software IQ
- Maintenance
Personal protective equipment
- Wearable equipment to protect worker from environmental factors and work stress
- Environmental: Repirators, gloves, boots, aprons, jumpsuits
- Workloads: exoskeletons
- Passive/active systems -- filtered air v. forced air
- Active sensors
- Important attributes
- Effects on seeing, hearing, work load, strength, movement
- Time/place for doning/dofing
Spacial relationship between worker/user and work objects
- Affects reach and walk distances (and how much time required) to get parts
- Organization affects workers ability, time, and mistakes finding necessary materials
- Affects workers/users ability to see & use equpment, e.g., location of keyboard, mouse, monitor and documents
- Affects work posture -- Oh my back, neck or shoulder!

Physcial environment
- Lighting
- Noise
- Thermal factors -- heat/cold, humidity, air movement, metabolic load, garments -- inside/outside
- Rain, snow, ice
- Respiratory hazards
- Skin contact hazards
- Radiation
Social environment
- Co-Workers
- supervisors
- Friends
- Family
Work Methods
- Method: A sequence of steps that identifies the worker actions, tools and materials used to complete the job
- Defining time study steps or elements.
- The method should be described with sufficient granularity that it is possible for all workers to reproduce the method that forms the basis the resulting time standard.
- The smallest steps (often referred to as motions) are Therbligs (from Gilbreth). see: Work Methods
- small steps can should be grouped to form meaningful time study elements.
- Steps that are linked in time and space.
- Time study elements may be reassigned to other workers to achieve consistent Workloads.
- Time study elements should have conspicuous starting and ending points timing purposes.
- The method forms the basis of the time standard and has important implicatons to productivity, quality and worer safety and health
- The method on which the work standard is based is referred to as the "standard method"
- Studies have shown that "move to get," "grasp," "move to put," and "put/positon" account
for most of the actions required to complet most assembly type work.
Aberg, U., 1963. Frequency of occurrence of basic MTM motions. Journal of the MTM Association, 8, pp.23-28.
- Sometimes we start by observing a job and describing the steps. We then identify the materials and tools used for each step and observed and possible environmental factors.
Identify and describe all of the worker factors that might affect work standards for the following Jobs.
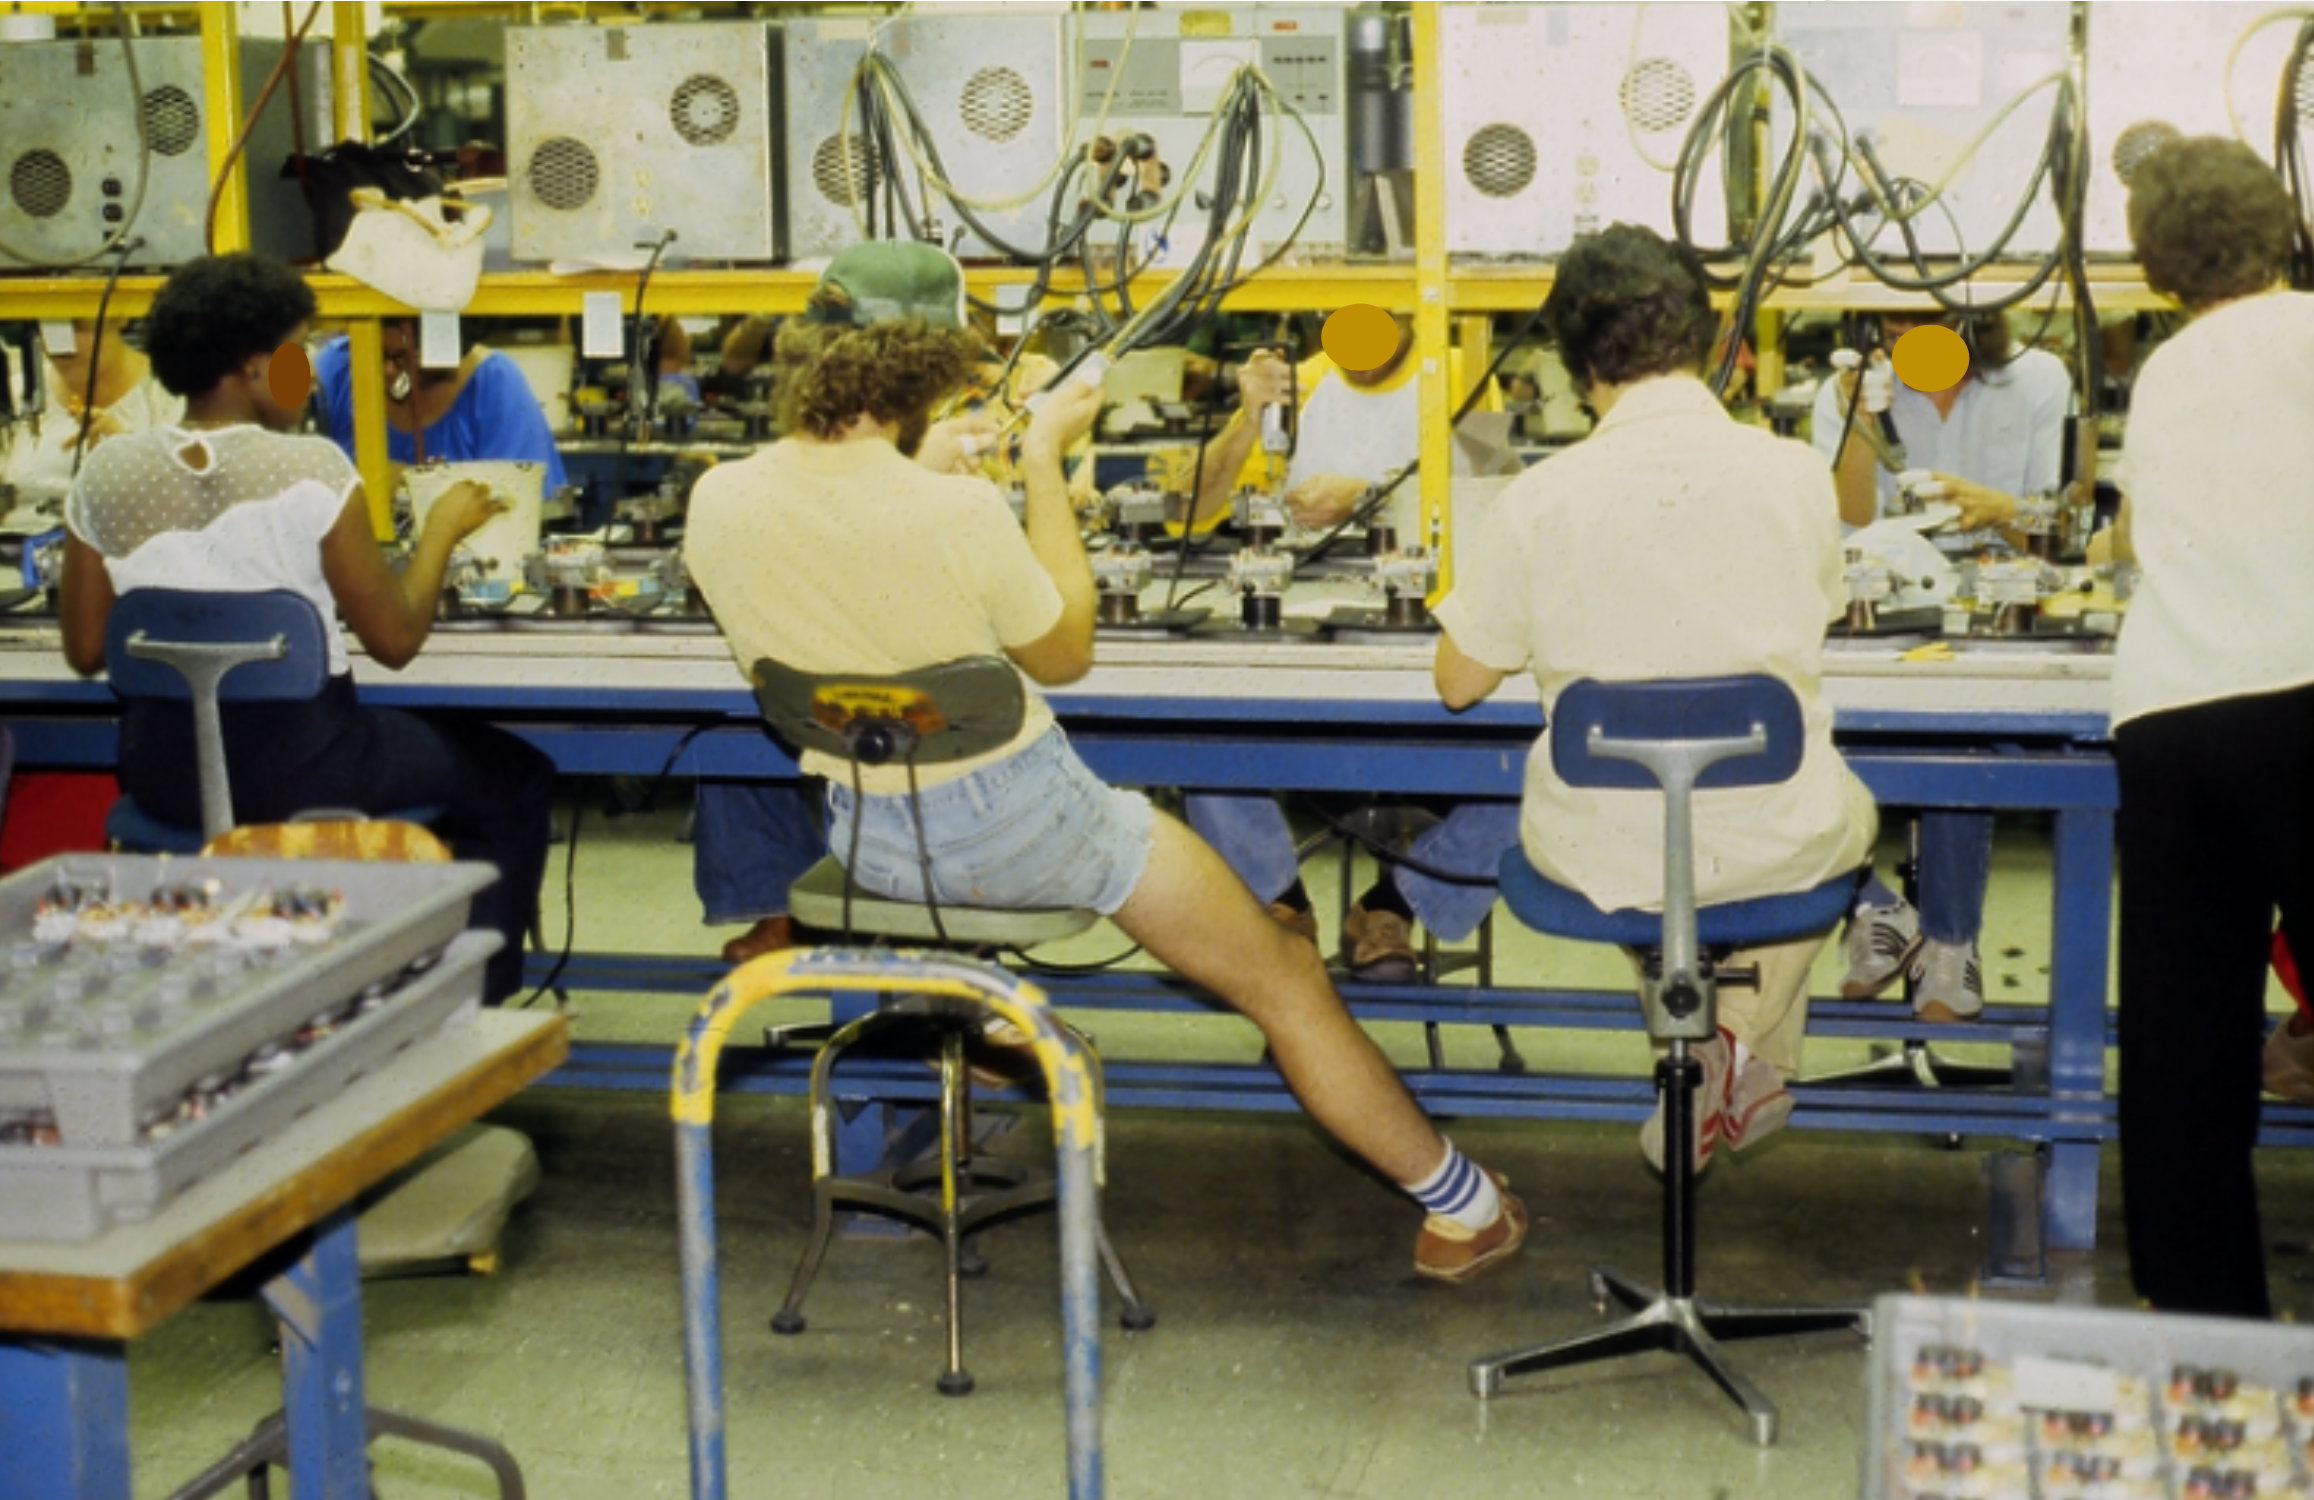
- Electronic assembly
 |  |
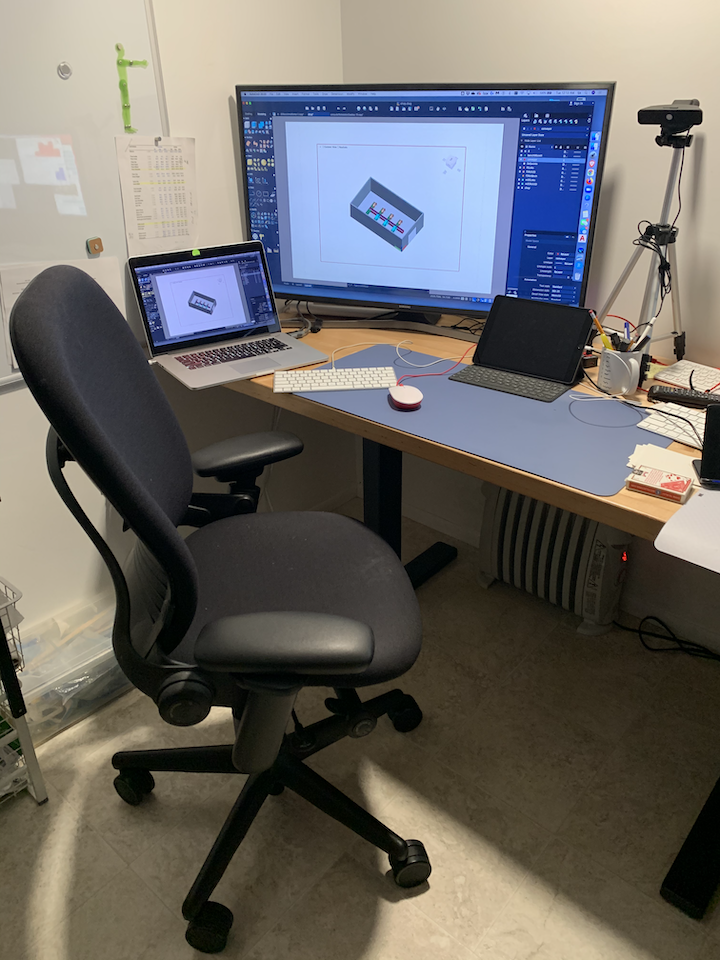
- CAD design
 |  |
- Workers/consumers
- Values/training
- General education
- Specific training
- Recent training
- Size/strength
- Physical and mental impairments
- Cultural factors
- How one feels on any given day
- Fatigue
- Injuries & illnesses