![]()
VI. PROJECT PLANNING AND OPERATIONS SCHEDULING
THREE FUNDAMENTAL ELEMENTS
The primary purpose of project planning is to provide mechanisms for continuous control over project activities by coordinating three elements:
(1) Operations: the things that must be done (activities or jobs), each with a sequential relation to other operations and each requiring resources for some time period.
(2) Resources: the things utilized in a program or project, normally reduced to a common standard of cost, but including personnel, equipment, materials, and time.
(3) Constraints: conditions imposed by outside factors, such as budgetary limits, completion deadlines, availability of resources, inputs from other units, and so forth.
Two basic requirements for the application of project planning techniques are:
(1) the ability to clearly state a work program (including the delineation of specific activities, jobs, or work elements) direct toward one or more defined objectives; and
(2) the skill to attach cost and other resource requirements/ constraints to each activity in the project.
A project plan should provide managers with the capacity to:
(1) consider the costs, in dollars and time, of pursuing alternative activities;
(2) establish criteria for resource allocation and scheduling;
(3) evaluate the accuracy of cost and resource estimates and to refine these estimates;
(4) identify and assess the effect of change with the minimum delay;
(5) revise and update the plan within an acceptable time period; and
(6) analyze and communicate data regarding the progress of the project.
An operations schedule details the sequence in which the activities must be carried out and:
(1) reflects the total resource capacity assigned to the program or project.
(2) takes into account the availability of resources, the sequence of activities or jobs, the resource requirements, and possible starting times for each activity.
(3) levels the use of resources to avoid dramatic shifts in resource requirements (particularly personnel).
PERFORMANCE REQUIREMENTS AND DECISION CRITERIA
Performance requirements define any constraints on how the project is to be carried out--such as imposed schedule deadlines, budgetary limitations, or requirements for doing the work in-house or by subcontract.
Exhibit 1. Performance Requirements and Decision Criteria
Decision criteria reflect the relative importance of project performance, development cost, production cost, and ultimate operational costs and may involve more sophisticated analytical techniques such as cost-benefit and cost-effectiveness analyses.
Broad tradeoffs must be made regarding how much is to be spent (cost) for how good an "end-product" (effectiveness).
Task Identification
A task can be defined as a set of activities that will lead to the achievement of some desired results in a program or project.
Each task must be detailed, including anticipated results, and then the tasks are sorted into logical groups, where the results of performing each grouping are observed and recorded.
The "knowns" of existing tasks are modified and rearranged in order to produce the desired results of a new project configuration.
Exhibit 2. Task Identification and Implementation Feasibility Analysis
Brainstorming, Opportunity Analysis, and the Delphi Technique
Brainstorming sessions should be unstructured, free-wheeling, unconstrained (Exhibit 3).
Efforts to refine, combine, and assign priorities to ideas should follow only after the project has been thoroughly discussed and all participants have had an opportunity to express themselves.
An opportunity analysis may be raise staff enthusiasm and develop more positive attitudes, with periodic sessions to discuss the current status of the project and to explore opportunities that may be presented.
The Delphi technique involves an iterative series of interrogations (usually through the use of questionnaires) of a panel of knowledgeable individuals.
o The relatively free exchange of brainstorming is replaced by a more formal exchange of information under the control of a steering group or exercise manager.
o After each round, the information generated in the previous stages is fed back to the participants so they may use it to revise their earlier responses (an often, to modify their attitudes concerning the project).
Exhibit 3. Brainstorming the Establishment of a Pre-natal Health Care Clinic
WORK BREAKDOWN SCHEDULE
A work breakdown schedule (WBS) is an important technique for developing a preliminary outline or "schematic" of the way in which supporting objectives mesh together to ensure the attainment of the major objectives.
o The WBS should allow the construction of a operations schedule that will reflect the interrelationships among the events and activities which make up a project or program.
o Tasks should be subdivided into smaller units--subtasks and activities--according to their interrelatedness; however, routine, repetitive work should not be excessively subdivided.
The WBS should be flexible enough that it can be expanded over time--in both depth and scope.
The initial division of work should not be made along organizational lines--any schedule below the first level will not reflect the dependencies or obligations among these units.
A general format for a work breakdown schedule is an indented decimal system (Exhibit 4).
o The first subdivision (1.0, 2.0, 3.0, and so on) represents the major tasks associated with the major project objectives.
o The second level (1.1, 1.2, 2.1, 2.2, etc.) represents the further breakdown of major tasks into subtasks.
o The third level (1.3.1, 1.3.2, 1.3.3, etc.) begins to identify specific activity clusters or job assignments that are required to successfully carry out the subtasks.
The following characteristics should be kept in mind In developing a work breakdown schedule:
(1) The WBS should be structured in a consistent, orderly, and hierarchical manner--each WBS element is the sum of all the work specified in the elements immediately below it.
(2) Each entry in the WBS should have its own, unique descriptive title which provides a brief identification of that work unit so that it is distinguishable from other work units.
(3) The WBS should be detailed to the extent necessary to provide a useful basis for managing the project; the subdivision should be based on interrelatedness; the level of detail need not be the same for all tasks.
(4) Extensive subdivision of routine, repetitious work should be avoided.
(5) Breaking down tasks according to organizational responsibilities should be avoided except at the lowest levels.
(6) Description of the work in each WBS element should be concise and jargon-free so that they are understandable within and outside the organization.
(7) A WBS can be used to prepare unit cost work statements, work authorizations, project schedules, progress reports, and technical performance evaluations.
(8) A graphic display similar in layout to an organization chart is also a highly effective way to represent a work breakdown schedule.
Exhibit 4. A Work Breakdown Schedule for Pre-natal Health Care Clinic
A Milestone Chart provides a sequential list of the various tasks to be accomplished in a project and an increased awareness of interdependencies between tasks.
o Tasks and milestones are displayed on charts adjacent to a time scale.
o Symbols on the time scale identify the dates (or times) that each milestone is scheduled, when it is completed, if slippage has occurred, and so forth.
o Data can be presented in various ways: by organizational units, by project and sub-project, by performance status, and so forth.
o While milestones are listed in chronological sequence, they are not necessarily related in a logical sequence, that is, not all important interrelationships can be displayed
o The Milestone Chart does not allow for measuring the effect of changes and slippages; it merely improves the reporting of them.
An arrow diagram provides the initial portrayal of a critical path network.
o Project elements--activities, tasks, jobs--are represented on a network by arrows.
o An activity cannot be started until the event preceding it has occurred.
o If an activity is denoted as a direct link between two nodes (events) in a network, an arrow (symbolizing the activity) indicates the direction of dependency and time flow from one node to another.
An arrow diagram is composed of a series of sequential relationships or paths--each path must be completed in the indicated sequence in order for the various activities to be carried out in proper relations one to another and for the overall project to be successfully implemented.
NETWORK ANALYSIS AND THE CRITICAL PATH METHOD
Network analysis produces a visual display of the tasks and activities to be performed in carry-ing out a program, providing a basis for determining the order in which activities should be undertaken--either their sequence or priority--and the critical linkages among activities.
Similarities Between CPM and PERT
Program Evaluation and Review Technique (PERT) is designed to deal with large-scale projects characterized by: (1) unclear objectives, (2) multiple or overlapping management responsibilities, (3) relatively high levels of uncertainty as to time requirements and costs, (4) complex problems of logistics, and (5) problems of sufficient complexity to justify the use of computers to track the project in some detail.
PERT is an event-oriented network. An event may be defined as the completion of an activity or task (i.e., a milestone).
The Critical Path Method (CPM) is described as a "back-of-an-envelope" or "in-the-field" approach, with much less dependence on data processing and computer programming skills, and is applicable to well-defined projects, under a single management, with clear objectives and limited levels of uncertainty.
The Critical Path Method is job- or activity-oriented. Activities are linked together in a sequence of dependence to form an arrow diagram, often without particular attention to the connecting points.
The arrow diagram or network is common to both methods.
o It is necessary to identify a "critical path" in the development of a PERT network.
o The "three time estimates" used in PERT can also be applied in CPM.
o PERT focuses on what is "done"; CPM focuses on the "doing."
Application of CPM
Under CPM, management functions are divided into two distinct phases:
(1) Planning--deciding what should be done; and
(2) Scheduling--determining when activities should be initiated.
Three basic questions must be answered about each activity to further establish the "links" between various activities:
(1) What must be done before this activity can begin?
(2) What must immediately follow this activity?
(3) What activities can be undertaken concurrently?
These questions identify the predecessor-successor relationships among activities.
The linkages among various activities to be undertaken in a pre-natal health care clinic project are shown in Exhibit 6. Activity descriptions, linkages, and estimated durations for these activities are shown in Exhibit 7.
Exhibit 6. Linkages and Predecessor-Successor Relationships
The following statements might be assumed to reflect the initial perceptions as to the linkages among the fourteen activities that comprise the management plan for the establishment of the pre-natal health care clinic:
(1) Locating the clinic space (1.1) and hiring and/or assigning staff to work in the clinic (2.1) are the initial subtasks of the project and can be performed concurrently.
(2) Ordering office equipment (1.3.2) must follow after the rental contract for the clinic space have been negotiated (1.2).
(3) Developing the appropriate layout of the space (1.3.1) is dependent, in part, on the receipt of office equipment (1.3.2) and securing office supplies and materials (1.3.4).
(4) Staff members cannot be certified (2.4) until they have been hired and/or assigned (2.1), oriented (2.2), and trained (2.3).
(5) The orientation (2.2) and training (2.3) of the staff can be carried out concurrently.
(6) Publicity on the clinic programs (3.2) must precede the screening and enrollment of eligible applicants (3.3).
(7) Program publicity cannot begin until space has been secured (1.2) and program information has been developed (3.1).
(8) The new clinic can be opened only after all other activities have been completed.
| Activity | Linked to: | Preceded by: | Followed by: |
| 1.1 | (1.2), (1.3.4) | None | (1.2), (1.3.4) |
| 1.2 | (1.1), (1.3.2), (3.1) | (1.1) | (1.3.2), (3.1) |
| 1.3.1 | (1.4), (1.3.2), (1.3.4) | (1.3.2),(1.3.4) | (1.4) |
| 1.3.2 | (1.2), (1.3.1) | (1.2) | (1.3.1) |
| 1.3.3 | (1.3.4), (1.4) | (1.3.4) | (1.4) |
| 1.3.4 | (1.1), (1.3.1), (1.3.3) | (1.1) | (1.3.1), (1.3.3) |
| 1.4 | (1.2.1), (1.3.3), (3.3) | (1.3.1), (1.3.3), (3.3) | None |
| 2.1 | (2.2), (2.3) | None | (2.2), (2.3) |
| 2.2 | (2.1), (2.4) | (2.1) | (2.4) |
| 2.3 | (2.1), (2.4) | (2.1) | (2.4) |
| 2.4 | (2.2), (2.3), (3.3) | (2.2), (2.3) | (3.3) |
| 3.1 | (1.2), (3.2) | (1.2) | (3.2) |
| 3.2 | (3.1), (3.3) | (3.1) | (3.3) |
| 3.3 | (1.4), (2.4), (3.2) | (2.4), (3.2) | (1.4) |
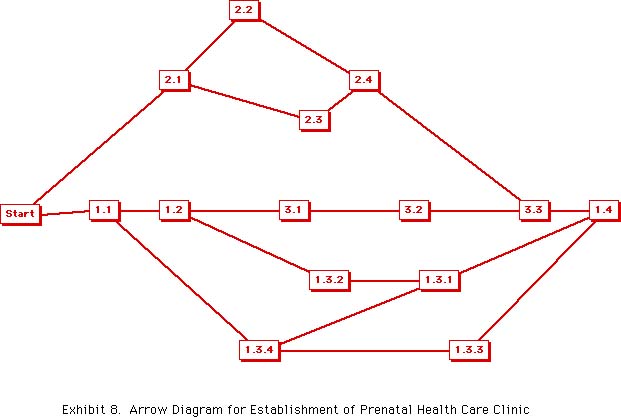
Calculations on the Network
These relationships can then be converted into an arrow diagram, as shown in Exhibit 8 (click here). The amount of time--or duration--required to complete a particular activity is assigned to the arrow on the network that represents that activity.
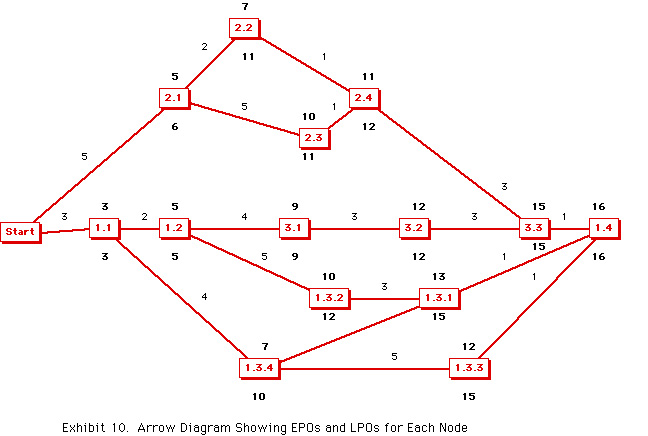
Beginning at "start," the time duration for each path (series of connected arrows) should then be summed to determine:
(1) The earliest possible time that an activity that terminates at a give node can be completed--known as the earliest possible occurrence or EPO.
(2) How long it will take to complete the entire project (project duration).
(3) Which activities establish and control the project duration (the critical path).
(4) How much leeway (float) exists for activities that do not control the project duration.
The EPO of the final activity node is the earliest possible completion time for the entire project.
The float of a given activity is the amount of time that the activity can be delayed or its duration extended without affecting the EPO of any other activity.
o To determine this operational leeway, subtract from the EPO of the final activity node the time durations back to the other nodes that lead to this final activity.
o These calculations determine the latest possible occurrence or LPO--the latest time that all of the activities terminating at a given node can finish without causing the project duration to exceed the originally determine project duration.
Whereas the EPO is the longest path from "start" to a given node, the LPO is the shortest path from the termination of the project back to a given node.
o Float is the difference between the EPO and the LPO.
o No activity with a positive float can control the duration of the entire project. Their durations can be shortened as much as is physically possible or extended by an amount equal to the float that they possess without affecting the EPO of any other activity.
"Critical" activities have zero float and form a continuous path, starting at the first activity and ending at the last one, as shown in Exhibit 10 (click here)
Summary of CPM Procedures
The following steps are involved in applying the Critical Path Method to a project or program:
(1) Define all of the activities that make up the project or program.
(2) Define the linkages and sequence of performance for each activity.
(3) Draw an arrow diagram to define the sequence of performing the various activities.
(4) Estimate the duration of each activity.
(5) Calculate the EPO and LPO for each activity node.
(6) Determine the float for each activity (the LPO minus the EPO).
(7) Locate the critical path, that is., those activities with zero float that form a continuous sequence from the beginning to the end of the diagram.
The critical path can be continuously monitored so that any potential delays can be determined before they occur.
Delays can be avoided by shifting personnel, materials, or other resource inputs to the critical path from those paths that have "float."
The CPM approach determines: (1) the sequential ordering of activities, (2) the maximum time required to complete the project or program, (3) costs involved, and (4) the ramifications in time and costs for altering the critical path.
Crash Scheduling
Crash scheduling may result in a shift in the critical path to activities having minimal float.
o Crash scheduling may produce a "staffing overload," whereby too many resources are assigned over too short a time period.
o Crash scheduling at the outset of a project may use up a management option that may become important later on once the project is operational.
Estimating Time Durations: The Problem of Uncertainty
It may be appropriate to provide a time estimate that reflects the most probable value of an unknown distribution function.
It may be feasible to assume some probability distribution function and to proceed to establish a range of confidence for the resulting time estimate.
The so-called beta distribution formula is shown below:
expected time = 1/6 (a + 4b + c),
where: a = the most optimistic time estimate b = the most likely time estimate, and c = the most pessimistic time estimate.
The beta distribution or expected time formula is based on the assumption that the variance of the distribution is the square of the standard deviation which, in turn, can be estimated as roughly one-sixth of the range (i.e., the difference between the most optimistic and the most pessimistic time estimate).
Exhibit 11. Estimate Time Durations for Pre-natal Health Care Clinic
| Activity | Optimistic | Most Likely | Pessimistic | te |
| 1.1 | 2 | 3 | 5 | 3.17 |
| 1.2 | 1 | 2 | 3 | 2.00 |
| 1.3.1 | 2 | 3 | 7 | 3.50 |
| 1.3.2 | 3 | 5 | 8 | 5.17 |
| 1.3.3 | 3 | 5 | 6 | 4.83 |
| 1.3.4 | 2 | 3 | 4 | 3.00 |
| 1.4 | 1 | 1 | 1 | 1.00 |
| 2.1 | 2 | 5 | 8 | 5.00 |
| 2.2 | 1 | 2 | 3 | 2.00 |
| 2.3 | 4 | 5 | 9 | 5.50 |
| 2.4 | 1 | 1 | 1 | 1.00 |
| 3.1 | 2 | 4 | 7 | 4.17 |
| 3.2 | 1 | 3 | 5 | 3.00 |
| 3.3 | 2 | 3 | 5 | 3.17 |
| Duration | 10 | 16 | 26 | 16.67 |
| Standard
Deviation |
(26 - 10)/6 = | 2.67 | ||
| F | (16-16.67) | /2.67 = | -0.250936 = | 40% |
Relationship Between Expected Time and Variance
Expected time corresponds to "average" or "mean" in common language--there is a fifty percent probability that the estimated time will be exceeded by the actual duration.
Variance is a measure of uncertainty--if the variance is large, there is greater uncertainty as to the time in which the activity will be completed.
The concept of variance can be used to evaluate the probability of meeting a specific time schedule.
o An F value can be determined by subtracting the earliest possible occurrence for any given activity from some imposed schedule completion time (S) and dividing the result by the standard deviation for that activity.
o By consulting a table of normal curve values, F values can be interpreted in terms of the probability of meeting the imposed schedule (Exhibit 12).
Exhibit 12. F Values for Levels of Risk/Probability of Success
| Probability | |
| of Success | F Value |
| 55% | 0.12085 |
| 60% | 0.25163 |
| 65% | 0.38217 |
| 70% | 0.52253 |
| 75% | 0.67277 |
| 80% | 0.84294 |
| 85% | 1.04282 |
| 90% | 1.28256 |
| 95% | 1.64173 |
| 100% | 3.87000 |
This method of assessing risk can be applied in reverse to determine an appropriate duration for any activity in a project (or for the total project duration), given some acceptable level of risk. The appropriate formula is as follows:
Imposed Schedule Deadline = F(Standard Deviation of te) + te.
o It may be possible to reduce the level of risk (increase the probability of success) from the 50 percent level (assumed by the beta distribution) by adding a relatively small amount of time to the estimated project duration.
o The increments of time required become increasingly larger beyond the 90 percent level of success, often beyond any realistic expectations.
Reducing the standard deviation (reducing the uncertainty) will reduce the additional time duration required for any chosen level of success.
Scheduling and Control
PERT and CPM provide mechanisms for systematic control, so that management need to be involved only when the program is off schedule or otherwise in trouble--a practice known as management by exception.
This concept of management control is based on three premises:
(1) Management must be concerned with coping with change;
(2) The future can never be predicted exactly; estimates will always differ from reality; and
(3) It is important to concentrate on solution to a given problem as soon as possible.
Exceptions are the deviations or difference between what management anticipates will happen (or what is scheduled to happen) and what actually does happen.
PERT and CPM are excellent tools of communication because they indicate clearly where responsibilities for supervision and management are assigned.
Heuristic Programming
PERT and CPM establish the criteria for scheduling, but the techniques for resource allocation and scheduling involve various heuristic programming techniques.
o A heuristic is any device or procedure used to reduce problem-solving efforts--a rule of thumb used to solve a particular problem.
o Leveling is accomplished by using the total float times to select the "best" starting time for each activity.
In developing a schedule, the critical path is determined by the segment of resources (personnel, equipment, etc.) that can be assigned to complete each activity.
o The requirement of scheduling is to establish a duration for each activity with varying levels of resource so that each activity is with the limits of peak efficiency and yields a minimum cost for the activity.
o The available resource capacity must be allocated according to the priority indicated by the program plan.
A relatively simple heuristic program can provide these guidelines:
(1) Allocate resources serially in time; that is, for the first time period, schedule all jobs possible given staff (or other limited resources), then do the same for the second time period, and so on.
(2) When several jobs compete for the same resources, give preference to the jobs with the least float or slack time.
(3) Reschedule noncritical jobs (those not on the critical path), if possible, in order to free resources for scheduling critical jobs.
By utilizing the slack time of various tasks to make "early starts," it may be possible to keep the project on schedule, within bounds of the limited staff resources, and at the same time, achieve a more even distribution of staff commitments.
Deviations from the predicted schedule should be used to revise the plan, adjust the allocation of resources, and recalculate the overall time schedule for the balance of the program.
Dynamic Response Cycle
Program management is best served by a real-time control system that responds according to the degree of urgency.
The dynamic cycle can establish: (1) the best resource level to assign to the project, and (2) the best use of resource levels in scheduling each activity in the project.
o Once a schedule has been established, a time-scale diagram can be produced to provide a visual simulation of the project for all levels of management.
o Progress reports can be posted on the diagram at regular intervals, and the actual result can be compared with the estimates to identify exceptions from the original plan.
Two significant fallacies associated with these techniques are: (1) assuming that these methods will do everything, and (2) assuming that they can be of no help at all.
Management has been defined as the judicious allocation of resources to accomplish agreed-upon objectives according to a plan and schedule, and the ability to react to deviations between predicted and actual results to forestall the development of unfavorable situations.