Milestone Charts and Arrow Diagrams
Contemporary techniques for project planning and operations scheduling can be traced back to the work of pioneers in the field of scientific management, such as Frederick Taylor and Henry Laurence Gantt. Taylor's time and motion studies are familiar to students of industrial engineering and business administration. Gantt Charts form the basis for many current production scheduling systems. The relative simplicity of the Gantt Chart is one reason why this technique continues to receive wide-spread application. The so-called time-line diagram is one of the more common forms of Gantt Charts used today.
Determining Milestones
Milestones are key elements or points in time that can be identified in the progress of a program or project. A Milestone Chart provides a sequential list of the various tasks to be accomplished in the program or project (tasks, in turn, can be broken down into specific activities if this level of detailed is warranted) and an increased awareness of the interdependencies between tasks. The list of tasks and milestones are displayed adjacent to a time scale. Symbols on the time scale identify the dates (or times) that each milestone is scheduled, when it is completed, if slippage has occurred, and so forth. This information can be accumulated in machine-readable form and, the data can be coded for various "sorts," using electronic data processing equipment: by organizational units, by project and subproject, by performance status, and so forth.
The duration of each task is indicated by an elongated U-shaped symbol. To show how the work is actually progressing, a line or bar can be drawn within the uprights of this symbol. The length of this line represents the amount of work actually completed to date. Bars to the left of any observation point (e.g., the end of the seventh weeks as indicated by the arrow) represent underaccomplishment, while those to the right represent overaccomplishment. Reasons for any delays can be noted on the chart by the use of codes or symbols.
The Milestone approach is not without its limitations. Relationships among tasks (milestones) still are not fully established. While listed in chronological sequence, milestones are not necessarily related in a logical sequence, that is, not all of the important interrelationships can be displayed. Further, the Milestone Chart does not allow for measuring the effect of changes and slippages; it merely improves the reporting of them.
Arrow Diagrams
An arrow diagram provides the initial portrayal of a critical path network. In an arrow diagram, elements of a project--activities--are represented on a network by arrows. An activity may represent a process, task, procurement cycle, or waiting time and may simply represent a connection or interdependency between two events on the network. An event is a specific, definable accomplishment in a program or project plan, recognizable at a particular point in time. An activity cannot be started until the event preceding it has occurred. Events do not consume time or resources and are normally represented in the network by circles, squares, or rectangles (called nodes).
If an activity is denoted as a direct link between two nodes (events) in a network, an arrow (symbolizing the activity) indicates the direction of dependency and time flow from one node to another. A dependency relationship is assumed to mean that, before the dependent activity can be initiated, the other related activity must be completed.
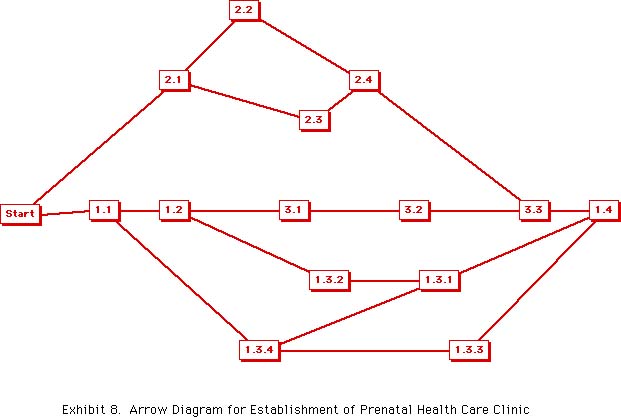
Since the nodes in the arrow diagrams represent the completion of an activity (i.e., an event), the term "start" often is used to anchor the initiation of the network (see Exhibit 8). Each arrow represents a linkage between events; more than one arrow can designate the same activity. For example, two arrows that terminate at the same node represent the same activity. This approach has certain advantages in determining time durations and in delimiting the critical path, as will be subsequently illustrated.
An arrow diagram is composed of a series of sequential relationships or paths. Each path should be completed in the indicated sequence in order for the various activities to be carried out in proper relation one to another and for the overall project to be successfully implemented. Once the various connections have been drawn, a critical route can be determined and progress can be more easily measured against key check points or milestones.
Associated with each arrow (activity) in the network is a time estimate called its duration--the amount of time required to complete the activity represented by the arrow. The next step in the CPM process, therefore, is to assign time estimates to each of the paths or arrows. Each arrow (activity) leading to a given node (event or activity completion) is assigned the time duration for the designated activity. In this way, all of the possible paths to that node can be easily traced.
Network Analysis and the Critical Path Method
The techniques of network analysis provide a useful and straight-forward approach by which to "map" the various steps required to implement a project or program. Networking provides a basis for determining the order in which activities should be undertaken--either their sequence or priority--and the critical linkages among activities. Even the most detailed and apparently complex networks are merely composites of a number of relatively simple networks. By understanding the basic techniques of network analysis, the public manager should be able to build a comprehensive analysis to convey specific assignments to those responsible for carrying out activities.
Origins of Network Analysis
Network analysis techniques have been used by industrial managers in production planning since the early 1900's. Process flow charts and programming techniques similar to the network analysis methods that form the basis for the Program Evaluation and Review Technique (PERT) were developed by industrial engineers prior to World War II. Similarly, business program analysts have used a work programming approach for many years that parallels the network algorithms used in both PERT and the Critical Path Method (CPM).
An investigation was initiated in 1956 at E.I. DuPont de Nemours to determine the extent to which the emerging capacity of high-speed computers might be applied to improve the planning, scheduling, and progress reporting of the company's engineering projects. Late in 1957, Morgan R. Walker, a DuPont engineer, and James E. Kelley, Jr., a Remington-Rand computer specialist, ran a pilot test on a unique arrow diagram, which subsequently came to be known as the Critical Path Method.
Concurrently, the U.S. Navy Special Projects Office, Bureau of Ordinance, established a research team to work on a similar strategy. The assignment of the SPO team--a project called PERT (Program Evaluation Research Task)--was aimed at formulating techniques for the efficient management of huge, complicated weapon systems development projects. What emerged was an approach to solve some of the fast multiplying problems of large-scale projects in which technical innovation, complex logistics, and concurrent activities must be integrated. PERT is credited (along with a dedicated, project-oriented management) with making it possible for the Navy to produce an operational ballistic missile-firing nuclear submarine years ahead of schedule. PERT was subsequently adapted and extended to hundreds of management situations, setting a pattern for project planning and control systems of the future.
Similarities Between CPM and PERT
PERT is the more sophisticated of the two approaches, being designed to deal with large-scale projects characterized by: (1) unclear objectives, (2) multiple and/or overlapping management responsibilities, (3) relatively high levels of uncertainty as to time requirements and costs, (4) complex problems of logistics, and (5) problems of sufficient complexity to justify the use of mainframe computers to track the project in some detail. The Critical Path Method, on the other hand, has been described as a "back-of-an-envelope" or "in-the-field" approach, with much less dependence on data processing and computer programming experience. CPM techniques are particularly applicable to well-defined projects under the direction of a single management, with relatively clear objectives and limited levels of uncertainty.
As both of these methods have been revised and improved, attractive features of one approach have been incorporated into the other. The arrow diagram or network is common to both methods. It is necessary to identify a "critical path" in the development of a PERT network, and the "three time estimates" used in PERT for dealing with uncertainty can also be applied in CPM. In current applications, differences are found in the diagram formats rather than in the underlying conceptual framework.
CPM focuses on the "doing," while PERT focuses on what is "done." The Critical Path Method is job- or activity-oriented, as illustrated in Exhibit 8. Jobs or activities are linked together in a sequence of depen-dence to form an arrow diagram. PERT is an event-oriented network. An event may be defined as the completion of an activity or task (i.e., a milestone).
The Critical Path Method has proven useful in guiding elemental, as well as complex public projects and programs. CPM is relatively easy to understand and apply. While software has been developed to permit the formulation of a CPM analysis on personal computers, the techniques are amenable to note pad sketching. Further, CPM can be used as a convenient tool to communicate program assignments--it provides a quick reference for relationships among dependent activities. For these reasons, the techniques of the Critical Path Method will serve as the primary focus in this discussion.
Applications of CPM
Under the Critical Path Method, management functions are divided into two distinct phases: (1) planning--deciding what should be done; and (2) scheduling--determining when activities should be initiated. With this separation, it is possible to determine which activities actually control significant completion times. Thus, program supervision can be based on the notion of management by exception. Attention can be directed to those activities most critical to the achievement of management and operational objectives. CPM facilitates the selection of a "best route" to be followed to reach these objectives. Potential obstacles and delays that might be encountered along the way also are identified.
Calculations on the Network
A time estimate or duration is associated with each activity in the network. The duration is the amount of time required to complete the particular activity represented by a given arrow. The next step in the CPM process is to assign time estimates to the arrows that form the paths.
The efforts of the Jefferson County Health Department to establish a pre-natal health care clinic in a section of the county where such health services have not previously been available can be used to further illustrate these CPM procedures. The initial perceptions as to the linkages among the fourteen activities previously identified in the work breakdown schedule are shown in Exhibit 6. The activity descriptions, linkages, and estimated durations for this project are given in Exhibit 7.
Exhibit 6. Linkages and Predecessor-Successor Relationships
The following statements might be assumed to reflect the initial perceptions as to the linkages among the fourteen activities that comprise the management plan for the establishment of the pre-natal health care clinic:
(1) Locating the clinic space (1.1) and hiring and/or assigning staff to work in the clinic (2.1) are the initial subtasks of the project and can be performed concurrently.
(2) Ordering office equipment (1.3.2) must follow after the rental contract for the clinic space have been negotiated (1.2).
(3) Developing the appropriate layout of the space (1.3.1) is dependent, in part, on the receipt of office equipment (1.3.2) and securing office supplies and materials (1.3.4).
(4) Staff members cannot be certified (2.4) until they have been hired and/or assigned (2.1), oriented (2.2), and trained (2.3).
(5) The orientation (2.2) and training (2.3) of the staff can be carried out concurrently.
(6) Publicity on the clinic programs (3.2) must precede the screening and enrollment of eligible applicants (3.3).
(7) Program publicity cannot begin until space has been secured (1.2) and program information has been developed (3.1).
(8) The new clinic can be opened only after all other activities have been completed.
______________________________________________________
| Activity | Linked to: | Preeceded by: | Followed by: |
| 1.1 | (1.2), (1.3.4) | None | (1.2), (1.3.4) |
| 1.2 | (1.1), (1.3.2), (3.1) | (1.1) | (1.3.2), (3.1) |
| 1.3.1 | (1.4), (1.3.2), (1.3.4) | (1.3.2),(1.3.4) | (1.4) |
| 1.3.2 | (1.2), (1.3.1) | (1.2) | (1.3.1) |
| 1.3.3 | (1.3.4), (1.4) | (1.3.4) | (1.4) |
| 1.3.4 | (1.1), (1.3.1), (1.3.3) | (1.1) | (1.3.1), (1.3.3) |
| 1.4 | (1.2.1), (1.3.3), (3.3) | (1.3.1), (1.3.3), (3.3) | None |
| 2.1 | (2.2), (2.3) | None | (2.2), (2.3) |
| 2.2 | (2.1), (2.4) | (2.1) | (2.4) |
| 2.3 | (2.1), (2.4) | (2.1) | (2.4) |
| 2.4 | (2.2), (2.3), (3.3) | (2.2), (2.3) | (3.3) |
| 3.1 | (1.2), (3.2) | (1.2) | (3.2) |
| 3.2 | (3.1), (3.3) | (3.1) | (3.3) |
| 3.3 | (1.4), (2.4), (3.2) | (2.4), (3.2) | (1.4) |
Exhibit 8 (click here) shows the arrow diagram for this project.
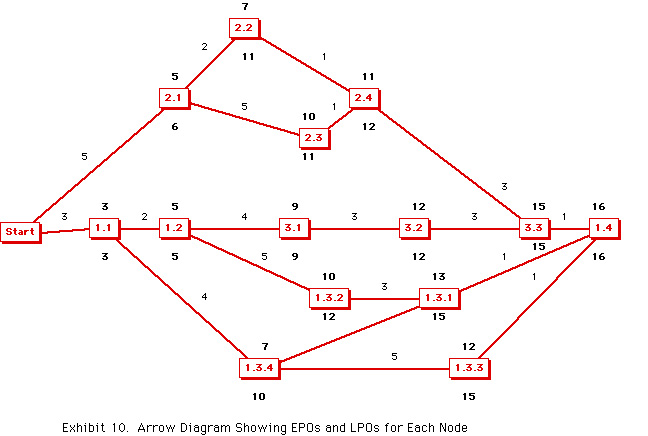
The time durations for each of the fourteen activities have been loaded on to the arrows in the network in Exhibit 9. Each arrow leading to a given node (event or activity completion) is assigned the time duration for the designated activity. In this way, all of the possible paths to that node can be easily traced.
Beginning at "start," the time duration for each path should be summed to determine:
(1) The earliest possible time that an activity that terminates at a give node can be completed--known as the earliest possible occurrence or EPO.
(2) How long it will take to complete the entire project (project duration).
(3) Which activities establish and control the project duration (the critical path).
(4) How much leeway (float) exists for those activities that do not control the project duration.
In Exhibit 9 (click here), for example, the path from "start" to 2.1 (hire/assign clinic staff) to 2.2 (orient staff to agency procedures) to 2.4 (certify staff members) is estimated to take 8 weeks, whereas the path from "start" to 2.1 to 2.3 (train staff in clinic operations) to 2.4 would take 11 weeks. Therefore, the EPO for the completion of activity 2.4 is 11 weeks. Other activities dependent on the completion of this activity (for example, screening applicants for eligibility) cannot begin until 14 weeks into the project.
The EPO of the final activity node has added significance--it is the earliest possible completion time for the entire project. Thus, activity 1.4 (open clinic to eligible applicants) cannot begin until 15 weeks into the project and has a duration of 1 week. Therefore, the project duration for the construction of a new water storage tank and pumping station is 16 weeks.
Operational Leeway: Float
The float of a given activity is the amount of time that the activity can be delayed or its duration extended without affecting the EPO of any other activity. To determine this operational leeway, calculations must be made by taking the EPO of the final activity node and subtracting the time durations back to the nodes that lead to this final activity. This process is repeated for each node, in turn, back to "start." These calculations determine the latest possible occurrence or LPO, that is, the latest time that all of the activities terminating at a given node can finish without causing the project to exceed the originally determine duration.
Whereas the EPO is the longest path from "start" to a given node, the LPO is the shortest path from the termination of the project back to a given node. The difference between the EPO and LPO represents the float for that activity.
The Critical Path
It should be clear that no activity with a positive float can control the duration of the entire project. The durations of these activities can be extended by an amount equal to the float that they possess without affecting the EPO of any other activity. This means that the EPO of the last activity node will not be affected and hence, that the project duration will not be altered. This characteristic of float limits the search for "critical" activities to those that have a float of zero.
Not all activities with zero float control the project duration, however. The activities that do control are those that have zero float and form a continuous path, starting at the first activity and ending at the last one. In Exhibit 10 (click here), this path is made up of the links between 1.1, 1.2, 3.1, 3.2, 3.3, and 1.4. If any of these activities are delayed, the project completion time will increase by the amount of that delay. This sequence of activities defines the critical path.
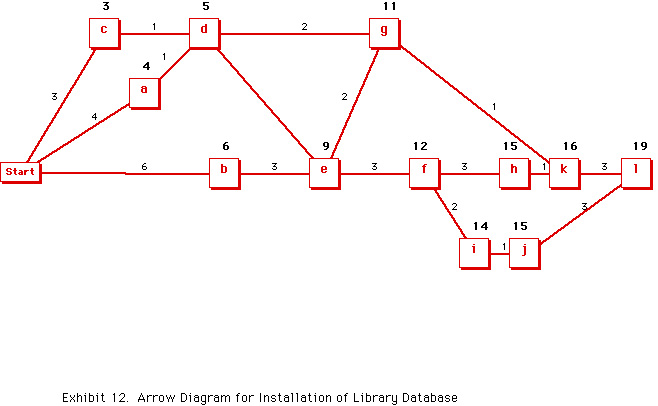
To outline another example, assume that the Board of the Public Library has authorized the development and installation of a computerized database of library holdings. The change over in the current cataloging and retrieval procedures will require the formulation of appropriate computer software (or the adaptation of "off-the-shelf" programs), hiring and training of personnel to operate the system, the acquisition and installation of computer equipment, and debugging and installation of the database and database management system. These basic tasks are further delineated by the library staff as a series of activities required to complete this project. The relationships among these activities and preliminary estimates of the time duration required for each activity are shown in Exhibit 11.
Three activities--recruitment, systems development, and equipment acquisition--can be initiated concurrently at the outset of the project. The development of software has the longest estimated duration of these three activities (6 weeks). However, initial training in the use of the computer equipment can begin in the fourth week after the equipment is purchased and delivered (3 weeks) and the new personnel are recruited and hired (4 weeks). Then, the training in the use of the software can begin in the sixth week. While the manual systems test cannot be initiated until the staff has been trained in the use of the software (at the end of week 9), this activity is not on the critical path (i.e., it has float). Equipment modification and testing are dependent upon the completion of the computer-personnel interface; however, these two equipment-related tasks also have float. Thus, the critical path is comprised of the sequence of activities: b, e, f, h, k, and l. This path can be confirmed by determining the LPO's for each of the activities in this sequence. The project duration, given the assigned times, is 19 weeks.
| Activity | Description | Preceded by: | Duration (weeks) |
| a | Position Recruiting | None | 4 |
| b | Systems Development | None | 6 |
| c | Equipment Acquisition | None | 3 |
| d | Equipment Training | a, c | 1 |
| e | Systems Training | b, d | 3 |
| f | Computer-Personnel Interface | e | 3 |
| g | Manual System Test | d, e | 2 |
| h | Preliminary Systems Changeover | f | 3 |
| i | Equipment Modification | f | 2 |
| j | Equipment Testing | i | 1 |
| k | System Debugging & Installation | g, h | 1 |
| l | Equipment Changeover | k, j | 3 |
The arrow diagram that delineates the sequential relationships among these activities is shown in Exhibit 12 (click here).
Summary of CPM Procedures
The steps involved in applying the Critical Path Method to a project or program are as follows:
(1) Define the activities that make up the project or program.
(2) Define the linkages and sequence of performance for each activity.
(3) Draw an arrow diagram or network that defines the sequence of performing the various activities.
(4) Estimate the duration of each activity.
(5) Calculate the EPO and LPO for each activity node.
(6) Determine the float for each activity (the LPO minus the EPO).
(7) Locate the critical path, i.e., those activities with zero float that form a continuous sequence from the beginning to the end of the diagram.
Once the actual program or project is implemented, the critical path can be continuously monitored so that potential delays can be identified before they occur. Such delays can be avoided by shifting personnel, materials, or other resource inputs to the critical path from those paths that have "float." Therefore, the identification of the critical path also provides the manager with a dynamic control mechanism.
In addition, the CPM network offers a convenient form of shorthand to express a complex set of relations. It offers a medium of communication and prediction. And it facilitates the subdivision of work so that each person involved can proceed with the more detailed planning of his or her part of the program or project.
The CPM approach provides a basis for an analysis of the costs involved when efforts are launched to utilize float time in order to reduce overall project costs. Or in those instances where a project deadline is imposed and therefore, the critical path may be reduced, CPM can assist in the determination of the cost of "crash scheduling." In general, the CPM approach determines: (1) the sequential ordering of activities, (2) the maximum time required to complete the project or program, (3) the costs involved, and (4) the ramifications in time and costs for altering the critical path.
Crash Scheduling
A manager may be tempted to use all available staff resources to complete the critical activities as they occur in the management plan. Depending on the nature of the project, however, such crash scheduling may merely result in a shift of the critical path to other activities having minimal float. It also may produce a "staffing overload," whereby too many resources are assigned over too short a period of time. The result may be increased inefficiency, as staff members literally get in each other's way. Crash scheduling at the outset of a project may use up a management option that may become important later on once the project is under way. The ability to "crash" on a critical path activity when it falls behind schedule (i.e., to reassign staff resources in an effort to get the critical activity back on schedule) is an important aspect of dynamic program management.
The general procedures for crashing scheduling are as follows:
(1) Determine the minimum project time and associated critical path: (a) if all activities are completed in normal time and (b) if all activities are crashed. The minimum project time when all activities are crashed determined the stopping point for the crash schedule analysis.
(2) Identify and crash the activity on the critical path with the minimum crash per unit of time. If there is more than one critical path, crash the activity on each paths with the minimum crash per unit of time.
(3) Revise the network, adjusting for the time and cost assigned to the crashed activity(s).
(4) Determine the critical paths, using normal activity times for noncrashed activities and crash schedule times for crashed activities. If the project time equals the crash schedule time computed in step (1), stop; otherwise, return to step (2).
The use of three time estimates, as described below, can provide the basis for determining the crash-time for a given activity--usually the most optimistic time estimate or a. The normal-time estimate can be either the most likely time, m, or the computed expected time, te
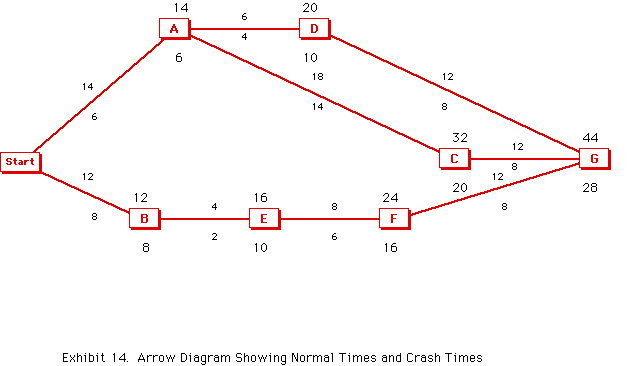
The procedures for crash scheduling can be illustrated by the following example. The normal and crash times and normal and crash costs for a project with seven subtasks are given in Exhibit 13. The project network is shown in Exhibit 14; subtasks A, C, and G form the critical path. Assuming normal times for the subtasks, the project duration is 44 weeks at a total cost of $64,000. If all subtasks are crash scheduled, the project time is 28 weeks at a total cost of $105,000. The crash-time cost per unit of time can be estimated by the following formula:
Crash Cost - Normal Cost (divided by) Normal Time - Crash Time
Subtask C on the critical path has the minimum crash cost per week (i.e., $20,000 minus $16,000 divided by 4 = $1,000). Crash scheduling this subtask reduces the project duration by 4 weeks but adds $4,000 to the total project cost. Subtask G has a crash cost of $1,250 per week; crash scheduling this subtask reduces the project duration by another 4 weeks and adds $6,000 to the total project cost. Subtask A also has a crash cost of $1,250 per week, and crash scheduling this subtask would reduce the project duration by 8 weeks to 28 weeks and add $10,000 to the total project cost. However, crash scheduling this subtask shifts the critical path to Subtasks B, E, F, and G which now have a project duration of 32 weeks. The final adjustment that can be made is to crash schedule Subtask B, which would bring the project duration back to the targeted 28 weeks at a total project cost of $92,000, or $13,000 less than if all of the subtasks are crashed.
| Time | (in weeks) | Costs | Costs | Crash Cost | |
| Subtask | Normal | Crashed | Normal | Crashed | per Week |
| A* | 14 | 6 | $14,000 | $24,000 | $1,250 |
| B | 12 | 8 | $10,000 | $20,000 | $2,500 |
| C* | 18 | 14 | $16,000 | $20,000 | $1,000 |
| D | 6 | 4 | $8,000 | $12,000 | $2,000 |
| E | 4 | 2 | $4,000 | $9,000 | $2,500 |
| F | 8 | 6 | $4,000 | $7,000 | $1,500 |
| G* | 12 | 8 | $8,000 | $13,000 | $1,250 |
| Total | $64,000 | $105,000 |
The data in Exhibit 13 can be shown in an arrow diagram (Exhibit 14, click here)
Estimating Time Durations: The Problem of Uncertainty
It often is difficult to predict the exact time duration of any given task or activity in a program or project. In such cases, it may be appropriate to provide a time estimate that reflects the most likely value of an unknown distribution function. If the variation of this distribution is relatively small, the most likely time duration may provide a reasonably close approximation of the actual time required to complete the activity. If the variance is large, however, the duration is said to be uncertain.
It is frequently argued that public programs all-too-often manifest such uncertainty as to severely limit the application of the rigor of network analysis techniques. This argument is fallacious, however, since these techniques were first developed and applied in industry and in the military because of uncertainty in time estimates.
The approach adopted by the original PERT team led to the develop-ment of the so-called beta distribution formula, as shown below:
expected time = 1/6 (a + 4b + c),
where: a = the most optimistic time estimate; b = the most likely time estimate; and c = the most pessimistic time estimate.
The beta distribution or expected time formula is based on the assumption that the duration of any activity or project is unimodal (that is, only one mode exists--b) and that the variance of the distribution is the square of the standard deviation which, in turn, can be estimated as roughly one-sixth of the range (i.e., the difference between the most optimistic and the most pessimistic time estimate).
The application of the beta distribution formula is relatively simple. When some doubt exists as to the appropriate time duration to be assigned to any activity, the manager should ask those who will be responsible for carrying out the activity: "If everything goes right with this job, what is the shortest time you will require to complete this activity?" Then the manager should ask: "If everything goes wrong--if the absolute worst happens--what is the longest time period required to complete this activity?" Finally, assuming the range established by the answers to the first two questions, the manager should ask: "What is the most likely time required to complete this activity?"
To gain a clear understanding of how the beta distribution formula can be applied under conditions of uncertainty, consider the following examples:
Example 1: Assume that the most optimistic time for the completion of some activity is 15 days; the most likely time in the judgment of the staff is 25 days; and the most pessimistic time is 35 days. Applying the formula the estimated time for completion would be:
1/6 (15 + 4x25 + 35) = 25.
Thus the most likely time and the computed time estimate are the same, which follows from the fact that the distribution of variance approximates a normal curve. The standard deviation in this example is 3.33 days (i.e., the most pessimistic time minus the most optimistic time, divided by six).
Example 2: Assume that the most optimistic and most likely time estimates remain the same (15 and 25 days respectively), but that the most pessimistic time estimate is extended to 47 days due to the uncertainty surrounding the completion of various activities. These conditions result in a distribution that is skewed to the left. Therefore, the computed time estimate lies to the right of the most likely time (i.e., the expected time is greater than the most likely time). Applying the beta distribution formula, expected time equals 27 days (i.e., 15 + 4x25 + 47, divided by 6), and the standard deviation in this example is 5 days.
Example 3: In the final example, the most likely and pessimistic time estimates are the same as in the first example (25 and 35 days respectively), while the most optimistic time estimate is reduced to 9 days. These estimates result in a distribution which is skewed to the right, with the expected time at 24 days being smaller than the most likely time. The standard deviation in this example is 4.33 days (i.e., 35 minus 9, divided by 6).
Relationship Between Expected Time and Variance
As may be seen from these three examples, expected time and variance--although statistically related--act somewhat independently in real-world situations. Expected time corresponds to "average" in common language--there is a fifty percent probability that the estimated time will be exceeded by the actual duration. Variance, on the other hand, is a measure of uncertainty. If the variance is large, there is greater uncertainty as to the time in which the activity will be completed. If the variance is small, it follows that the uncertainty will be small. Thus, although the estimated time in the third example is less than in the first (24 days as compared to 25 days), the third example evidences greater uncertainty, as illustrated by the larger variance (i.e., the square of the standard deviation or 18.75 days).
The concept of variance can be used to evaluate the probability (or risk) of meeting a specific time schedule. An F value can be determined by subtracting the earliest possible occurrence for any given activity from some imposed schedule completion time (S) and dividing the result by the standard deviation for that activity. By consulting a table of values for the normal curve, this F value can then be interpreted in terms of the probability of meeting the imposed schedule.
| Activity | Optimistic | Most Likely | Pessimistic | te |
| 1.1 | 2 | 3 | 5 | 3.17 |
| 1.2 | 1 | 2 | 3 | 2.00 |
| 1.3.1 | 2 | 3 | 7 | 3.50 |
| 1.3.2 | 3 | 5 | 8 | 5.17 |
| 1.3.3 | 3 | 5 | 6 | 4.83 |
| 1.3.4 | 2 | 3 | 4 | 3.00 |
| 1.4 | 1 | 1 | 1 | 1.00 |
| 2.1 | 2 | 5 | 8 | 5.00 |
| 2.2 | 1 | 2 | 3 | 2.00 |
| 2.3 | 4 | 5 | 9 | 5.50 |
| 2.4 | 1 | 1 | 1 | 1.00 |
| 3.1 | 2 | 4 | 7 | 4.17 |
| 3.2 | 1 | 3 | 5 | 3.00 |
| 3.3 | 2 | 3 | 5 | 3.17 |
| Duration | 10 | 16 | 26 | 16.67 |
| Standard
Deviation |
(26 - 10)/6 = | 2.67 | ||
| F | (16-16.67) | /2.67 = | -0.250936 = | 40% |
To illustrate these procedures, assume that three time estimates are obtained for each activity in the pre-natal health care clinic project, as shown in Exhibit 15. The values of the te and the variance must be computed for each activity. Using the te values, the EPO and LPO can be determined for each activity in the network, and a new critical path can be identified for the project. Given the adjusted critical path, what is the probability of completing the project within 16 weeks or less? The calculations to determine the F value are as follows:
F = Imposed Schedule Deadline minus Expected Duration (divided by) Standard Deviation of Expected Duration
F = 16 - 16.67/2.67 = - 0.2509
From a table of values for the standard normal distribution function, it can be determined that the value for - 0.2509 is 0.40. In other words, there is only a 40 percent chance of the project being completed in 16 weeks.
This method of assessing risk can be applied in reverse to determine an appropriate duration for any activity in a project (or for the total project duration), given some acceptable level of risk (as determined by the project manager or decision maker). Again using the expected duration in the water storage tank project, assume that a 20 percent level of risk is chosen. What time duration should be allowed for the completion of the project? The appropriate formula is as follows:
Imposed Schedule Deadline = F(Standard Deviation of te) + te.
The F value for a 20% level of risk (that is, an 80% probability of success) is approximately 0.843. Therefore, the project duration to achieve this projected level of success would be: 0.843(2.67) plus 16.67 or approximately 19 weeks. To raise the probability of success to a 90% level (10% level of risk) would require approximately 3.4 additional weeks (or a total of 20 weeks), whereas to approach a success level of 100% would require nearly 10.33 weeks beyond the 16.67-week duration. The F values for various probabilities of success are provided in Exhibit 16.
| Probability of Success | F Value |
| 55% | 0.12085 |
| 60% | 0.25163 |
| 65% | 0.38217 |
| 70% | 0.52253 |
| 75% | 0.67277 |
| 80% | 0.84294 |
| 85% | 1.04282 |
| 90% | 1.28256 |
| 95% | 1.64173 |
| 100% | 3.87000 |
While it may be possible to reduce the level of risk (increase the probability of success) from the 50 percent level (assumed by the beta distribution) by adding a relatively small amount of time to the estimated project duration, the increments of time required become increasingly larger above the 90% level of success, often beyond any realistic expectations. Changes in the standard deviation of the expected duration will have a significant impact on the additional time required to increase the probability of success. Reducing the standard deviation (reducing the uncertainty) will reduce the additional time duration required for any chosen level of success.
In most situations, the three time estimate approach of the beta distribution gives a more pessimistic outlook than would be obtained by using only the most likely duration. Staff members have a tendency to "hedge their bets" when asked to provide three time estimates, i.e., to be more conservative. In many projects, the manager should use the best time estimate possible and then control the project in a dynamic fashion. In short, regardless of how the estimate of time is obtained, a major responsibility of management is to control the project or program once it is implemented.
Heuristic Programming
The term heuristic, as a noun, is derived from the Greek verb heuriskein, meaning "to discover." In ancient times, heuristics was the name of a branch of philosophical study, the aim of which was to investigate the methods of discovery and invention. In its present usage, the meaning has expanded somewhat: a heuristic may be any device or procedure used to reduce problem-solving efforts--in short, a rule of thumb used to solve a particular problem.
Some rather sophisticated extensions of this basically simple notion, when combined with modern data-processing hardware and software, enable solutions to be developed to many problems that have not previously yielded to established problem-solving techniques. While heuristics may not lead to the best solution in all cases, experience over time have proved their general usefulness in finding good solutions to recurring problems with a minimum of effort.
A requirement in producing any schedule is to level the use of resources. This leveling is accomplished by using the total float times to select the "best" starting time for each activity. Thus, in developing a schedule, the critical path is determined not so much by the duration of the various activities, but by the segment of resources (personnel, equipment, funds, etc.) that can be assigned out of the total resource capacity in order to complete each activity.
This situation illustrates the essence of the resource allocation problem. A plan shows the proper sequence and optimum utilization of resources for minimum durations. However, in order to arrive at a schedule (so that the work required to complete the program can be carried out most effectively), it is necessary to allocate the available resource capacity according to the priorities indicated by the plan to remain within the limits of peak efficiency.
If the project is to be kept on schedule and deadlines are to be met, some guidelines are required to assist the project manager in the task of assigning these limited resources A relatively simple heuristic program can provide these guidelines:
(1) Allocate resources serially in time; that is, for the first time period, schedule all jobs possible given staff (or other limited resources), then do the same for the second time period, and so on.
(2) When several jobs compete for the same resources, give preference to the jobs with the least float or slack time.
(3) Reschedule noncritical jobs (those not on the critical path), if possible, in order to free resources for scheduling critical jobs.
By making these minor adjustments in scheduling--utilizing the float or slack time of various tasks to make "early starts"--it is possible to maintain the project on schedule, within bounds of the limited staff resources, and at the same time, to achieve a more even distribution of staff commitments. Under conditions of limited resources, it may be necessary to extend the time period of the project in order to maintain the constraints. By utilizing the basic heuristic programming approach, however, the necessary time extensions to achieve an optimal schedule can be minimized.
Failure to proceed beyond the determination of the critical path has prevented many users from realizing the full benefits of PERT and CPM. Further, once the predicted schedule is determined, the program must be monitored against actual performance, and management control must be exercised at all levels of supervision. Deviations from the predicted schedule should be used to revise the plan, adjust the allocation of resources, and recalculate the overall time schedule for the balance of the program.
Computer Applications
Mainframe (and later minicomputer) programs have been written to handle project planning tasks formerly relegated to hand-drawn PERT, CPM, and milestone charts. These large systems, such as Atemis, Phoenix PMS, Project Manager, Vision, SAS/O.R., and Telleplan, typically cost $15,000 to $200,000 and support virtually every function, method, analytic technique, and reporting style that a manager could want in such software. Large systems also offer access to large databases, provide built-in multi-user capabilities, and facilitate an evaluation of the scope and progress of a project in considerable detail by drawing on broad organizational data resources.
Project planning is a highly visual process, based on the use of charts, diagrams, and tables to track and analyze project data. Therefore, the Macintosh should be a natural engine for such systems. However, until about 1988, most ambitious project planning software for desktop use was written for the IBM PC (released in 1983). Initial software developed for the Macintosh includes MacProject and Micro Planner. More recently, however, the many new project planning software packages have been introduced to the PC market place, providing the Macintosh user a wide range from which to choose. Over 25 programs are currently available, ranging in price from $99 to $1,995.
With the recent introduction and enhancement of these Macintosh-oriented software packages, most public agencies that have any desktop computing capabilities can get into the business of project planning without having to rely on complicated mainframe applications. While the microcomputer has replaced the "back of the envelope" approach to project management, it has also significantly enhanced the range of analyses that can be carried out to ensure that project objectives will be achieved as efficiently and effectively as possible.
Dynamic Response Cycle
Program management is best served by a real-time control system--one that makes it possible to respond to situations according to their degree of urgency. Managers do not even need to be informed if no action is required or if the program is self-correcting. This is management by exception as it should operate.
Two significant fallacies associated with the application of these techniques are: (1) assuming that these methods will do everything, and (2) assuming that they can be of no help at all. Project planning techniques are criticized, at times, as not being all that useful because they cannot prevent such problems as missed deadlines established for projects, prevent cost overruns, or avert delays due to bad weather or other natural causes. The fact of the matter is that no method will ever eliminate or prevent these problems of program management. The idea is to attack such problems methodically--this is the essence of good management.
To say that real use cannot be made of these methods is to ignore the many occasions on which they have been of significant assistance in programs, both large and small. Any method, if it provides a better answer than another, should be used. The real problem seems to be not whether the method itself can be useful but rather, whether people will adopt it and apply it.
Management--and especially fiscal management--has been defined as the judicious allocation of resources to accomplish agreed-upon objectives according to a plan and schedule. Effective management also requires the ability to forestall the development of unfavorable situations by reacting quickly to deviations between predicted and actual results . Of necessity, management involves a balance between subjective ability and objective (or scientific) methods.
The complexities of government and increased demands for more effective utilization of limited public resources give rise to the need for a new breed of public management personnel. This new breed cannot afford to operate on its wits alone, as public managers often were able to do in the past. Like it or not, today's public manager must be willing to understand and to use all the management techniques at his or her disposal. A new project cannot be launched, a new facility built, or any public program successfully initiated and operated unless there is a plan and a schedule of work--one which permits public managers to exercise dynamic control throughout the program.