
Description of TM NDVI for Stinchfield Woods
Both Landsat TM and AVHRR digital data was obtained for a field study area northwest of Ann Arbor, Michigan. The field study area that was included in both sets of data is the University of Michigan property holding of Stinchfield Woods near Portage Lake. The general location of the field study area can be seen in Figure 2.
The Landsat TM data obtained was registered to the University of Michigan and was provided by Dr. Charles E. Olson Jr. of the University of Michigan School of Natural Resources. It consisted of the distortion-corrected digital numbers (for an area about 4 times larger than the woods) of all 7 TM channels. The data itself was for July 1995 and in the form of a pixel by pixel array: 120 rows by 135 columns.
The arrays for the TM red channel, Band 3, (0.63-0.69 microns) and the TM NIR channel, Band 4, (0.76-0.90 microns) were utilized by creating the following code to calculate a new array of the corresponding pixel by pixel Normalized Difference Vegetation Index:
=((TM4-TM3)/(TM4+TM3))
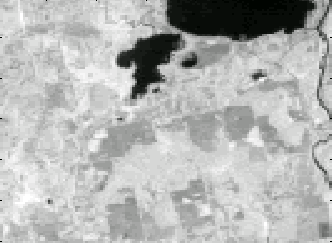
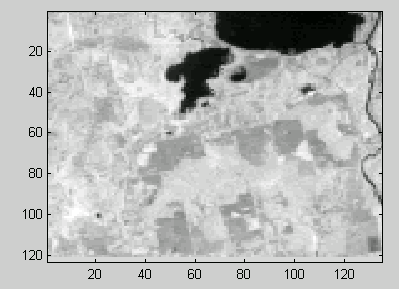
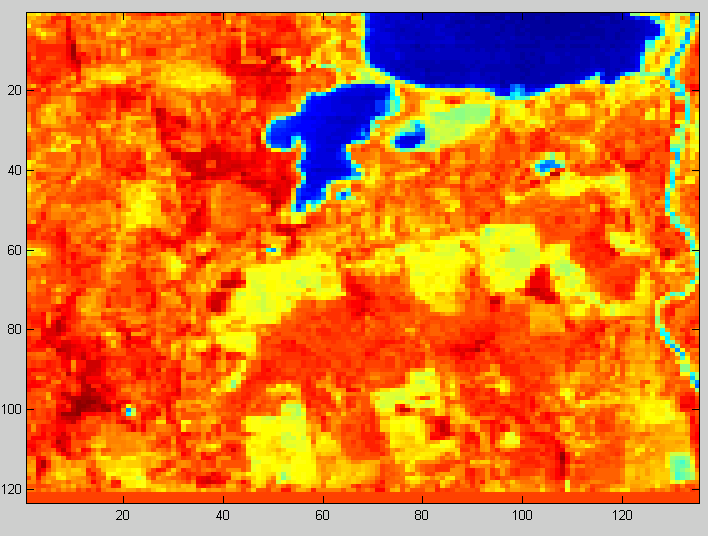
A computed NDVI array for the TM data was then inputted into an algorithm that produces graymaps. This was done with the help of Adam Thodey (a fellow College of Engineering graduate student). The resulting NDVI graymap can be seen as Figure 3.
The graymap does give a fairly reasonable representation of the Normalized Difference Vegetation Index. The graduated steps from black to white, though not perfectly spaced, do correspond to a correct and appropriate increase in NDVI values or "greenness." The findings of a field check of the area (in order to "ground truth") follow.
The first strikingly noticeable features of the graymap are the black areas, which correspond to the negative NDVI values of water. The largest is Portage Lake in the vicinity of R10C100 (Row 10 and Column 100, see edge scale on graymap). A rough spectral curve corresponding to a 3 pixel by 3 pixel training set near R10C100 can be seen in Figure 4. The decreasing slope between bands 3 and 4 is a graphical representation of the resulting negative NDVI. Just below and to the left of Portage Lake on the graymap is Little Portage Lake at R30C60. Just to the right of that is a small pond at R30C80, which has a marsh surrounding it that shows up as dark gray due to its relatively low NDVI (see Figure 3). Also showing up as a significant water area, around R40C104, is the wastewater treatment facility for the Portage Lake residences. An obvious river of black or very dark gray pixels, representing the Huron River, runs from R0C133 to almost R100C135.
The area that corresponds to Stinchfield Woods within this graymap is roughly rectangular and bounded by corners at R120C42, R65C38, R38C117, and R110C130. On the whole, fairly distinct regions of dark gray surround a central band of lighter gray within this field area. In general, these dark gray regions, the larger ones being around R70C50 (see Figure 3), R110C50 and R70C85, represent areas of coniferous forests that are medium scale NDVI values of slight greenness. These coniferous forests consist largely of white pine, red pine, and Norway spruce that were originally planted by the university. Some may be over 60 years old. As for the lighter gray region, it is mostly made up of such broadleaf species as oak and hickories, which correspond to fairly bright NDVI values and greenness (see the R80C55 spectral curve plot in Figure 4). These broadleaf forests vary from old growth in most cases to younger trees in a few areas which tend to be brighter. Figure 5 shows a plot of the actual Stinchfield Woods property and includes the tree species that were planted before 1961. If one compares Figures 3 and 5, one can see that the dark and light areas truly do represent tracts of conifer and broadleaf species within the woods.
There are a couple of areas that are particularly bright, almost white on the graymap. All of these areas were intentionally field checked, starting with the brightest at R70C102. This area which is strikingly noticeable on the graymap could almost be overlooked in the field, especially in the summer, if one was not specifically trying to locate it. Upon location and close inspection, the main characteristic of this area is that the entire growth is of the same age, with most trees of similar height: not taller than 40' and commonly 20-25'. The majority of the trees are broadleaf species typical to the woods: oaks and hickories in addition to some elm, cherry, and maple. The resulting canopy of this growth would easily show up very green in terms of NDVI during the summer because its denseness and equal height would lead to enhanced near-infrared reflection. Indeed, the red edge slope of the spectral curve for this area is the steepest in Figure 4. There are actually some even younger growth of conifers intermixed in this area, but at the time of this data, they would be most likely below the broadleaf canopy, not detracting from such an intense "green" pixel average.
Some research of the history for Stinchfield Woods reveals the reason for this bright growth area. According to Olson, this area experienced an extreme loss of trees as a result of an ice storm in the late 1960s, after the publication of Figure 5. Sure enough, if one compares the location of this bright spot on the graymap with the location of Jack pines in Figure 5, one finds that they are the same. This is because the Jack pine species branch structure was the most susceptible to ice buildup during this storm and experienced the most loss. Since this time, the area has been steadily taken over and filled in by broadleaf species.
The other bright spot near R72C39 upon field checking turned out to be quite similar to the previous area. It had equal height broadleaf growth of the same species also, although the trees on average were slightly taller and not as dense. It turns out that this area historically was Western Yellow pine, but had to be cleared due to a sickness brought on by beetle species [Olson].
The three fairly dark gray areas within the perimeter of Stinchfield Woods, although not perfectly represented on the graymap, actually correspond to NDVI values closer to zero: in other words, areas of less "greenness." These areas when field checked proved to be gravel pits. The darkest area found around R93C42 is an active gravel pit, privately run. A slightly larger gravel pit, but apparently not recently active, is represented by the gray pixels around R106C97. Lastly, a small gravel pit that is in use and no more than 30 meters across shows up as one dark gray pixel among a conifer forest at about R60C97. All three of these areas are bordered by vegetative growth which would increase there pixel average.
Two University of Michigan structural undertakings also can be found in the graymap. The Radio Astronomy Observatory, which includes a 26 meter diameter radio dish, a few buildings, and surrounding pavement, is depicted in a spread of fairly dark gray pixels near R95C62. The 1000' WUOM radio tower and support building show up as a few gray pixels at about R50C114. These types of man-made structures, as with urban areas, tend to contribute to overall lower NDVI values and, hence, lower pixel average.
Outside of the official Stinchfield Woods boundaries, but still on the graymap, are a few points of interest. At R115C125 is an agricultural field, which shows up between conifer and broadleaf species in terms of "greenness." The resulting spectral curve with red edge slope can be seen in Figure 4. Just up and to the right of the wastewater treatment facility one can see the intersection of the paved roads Dexter-Pinckney and McGregor. These roads are narrower than the field of view of a single pixel, but in this area apparently contributed enough in bringing down the corresponding NDVI of a stretch of single pixels. Another road, this time the gravel Toma Road, can be seen running from about R20C20 to R60C34, an area where it is not tree covered as it is elsewhere.
Finally, running parallel to Toma Road and spanning the entire graymap from roughly R0C10 to R120C35 is a stretch of pixels which on the whole are lighter grays than their surroundings. This may be seen better by varying the angle at which one views the graymap. This turns out to be a real representation of an area where a pipeline was placed about a decade prior the date of this data. Young vegetation growth is filling in the area that was cut and dug up when placing the pipeline, thus, producing higher NDVI values which are brighter (greener) in terms of this graymap scale due to their homogenous growth.
Click Here for a map of the original plantings in Stinchfield Woods.
