The first three maps were created using base maps from the Digital Chart of the World. The data (including elevation profiles) was converted into a shape file and imported into Arcview.
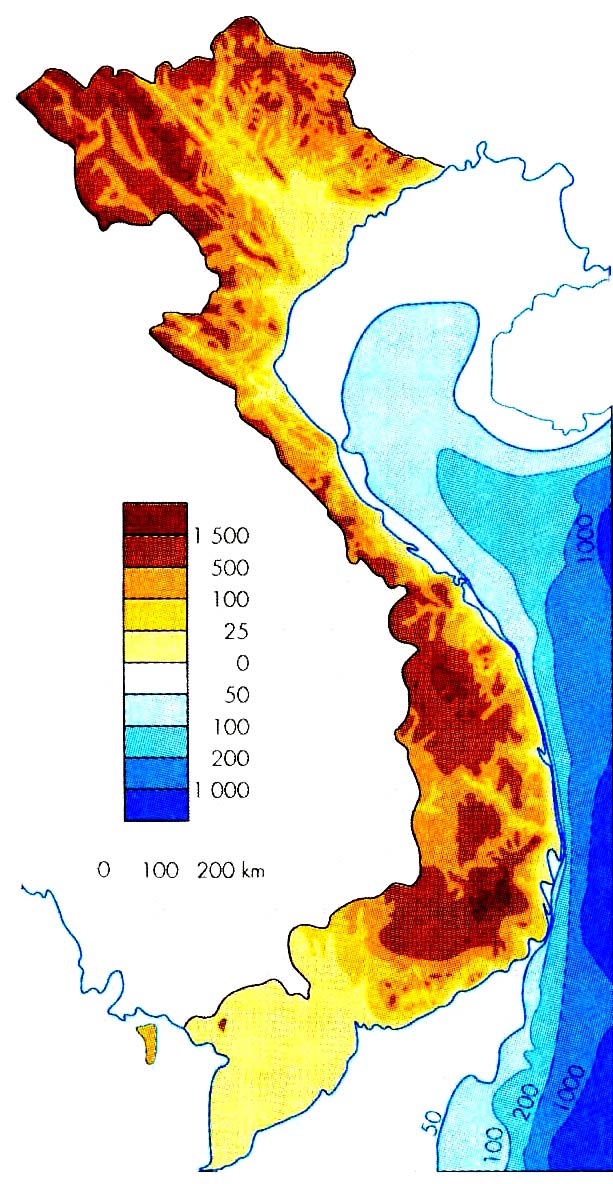
In the map above, elevation profiles are color-coded in the following manner:
Clear= Sea Level to 100 meters; Yellow= 100 to 500 meters
Blue= 500 meters to 1,000 meters; Green= Above 1,000 meters
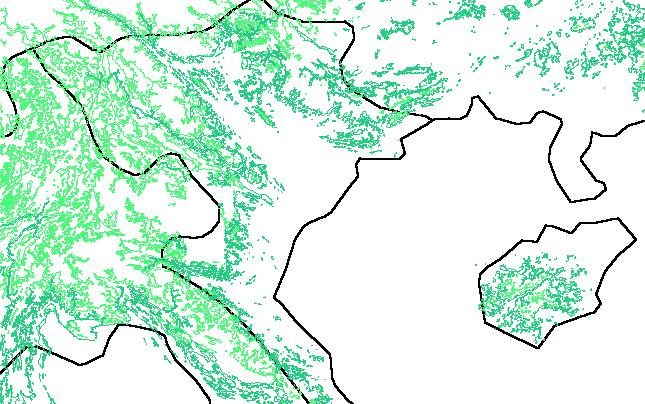
The elevation map (above) is a close-up of North and North-Central Viet Nam. Again, elevation profiles are color-coded in various shades of green to indicate montane hills and highlands. Unmarked zones indicate low-lying river deltas and coastal areas.
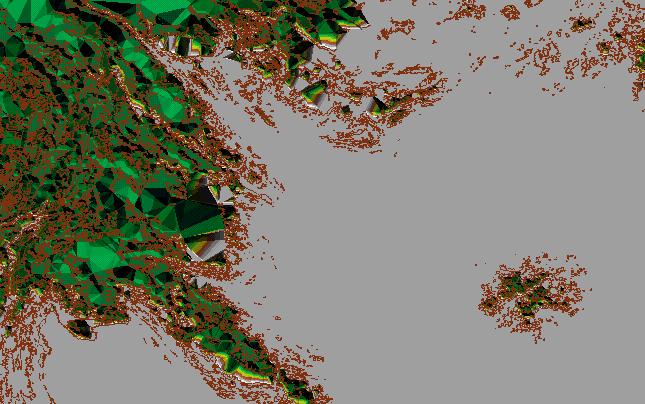
This elevation map was made using 3-D extensions within Arcview.
Green polygons add depth to regions 100 meters or more above sea level. Although geopolitical borders are not present here, Hai Nan island (East) as well as the Red River Delta (North-Central) and Annamite Cordillera (Center-Southwest) are clearly visible due to the coloring.
Two elevation maps are placed side-by-side here to make the visual translation clearer.
By juxtaposing the population map with a relief map, a clear (though unsurprising) pattern emerges correlating wet-rice agricultural production with higher population densities. Source: 1989 Population Statistics in Tropical Forestry Action Plan for Viet Nam (1991).
Legend (Person /km2)
1 = < 100
2 = 100-200
3= 201-500
4= 501-1,000
5= > 1,000