Sgr A* -- Swift Monitoring Program 2013 - 2024
Nathalie Degenaar (PI), Mark Reynolds, Jon Miller, Rudy Wijnands, Jamie Kennea et al.
Swift Quasi-Daily Monitoring of the Galactic Center
Introduction
This is the home page for the Swift monitoring campaign of the Galactic center. Using almost daily observations since 2006, this program has provided a unique baseline to study the long-term X-ray behavior of the central super-massive black hole Sgr A*. We post daily updates of the Swift data to allow for a quick response if the activity of Sgr A* changes, e.g., due to its potential interaction with objects such as "G2". When using these results for publications or triggering observing proposals, kindly cite Degenaar et al. (2015) for a description of the Swift program.
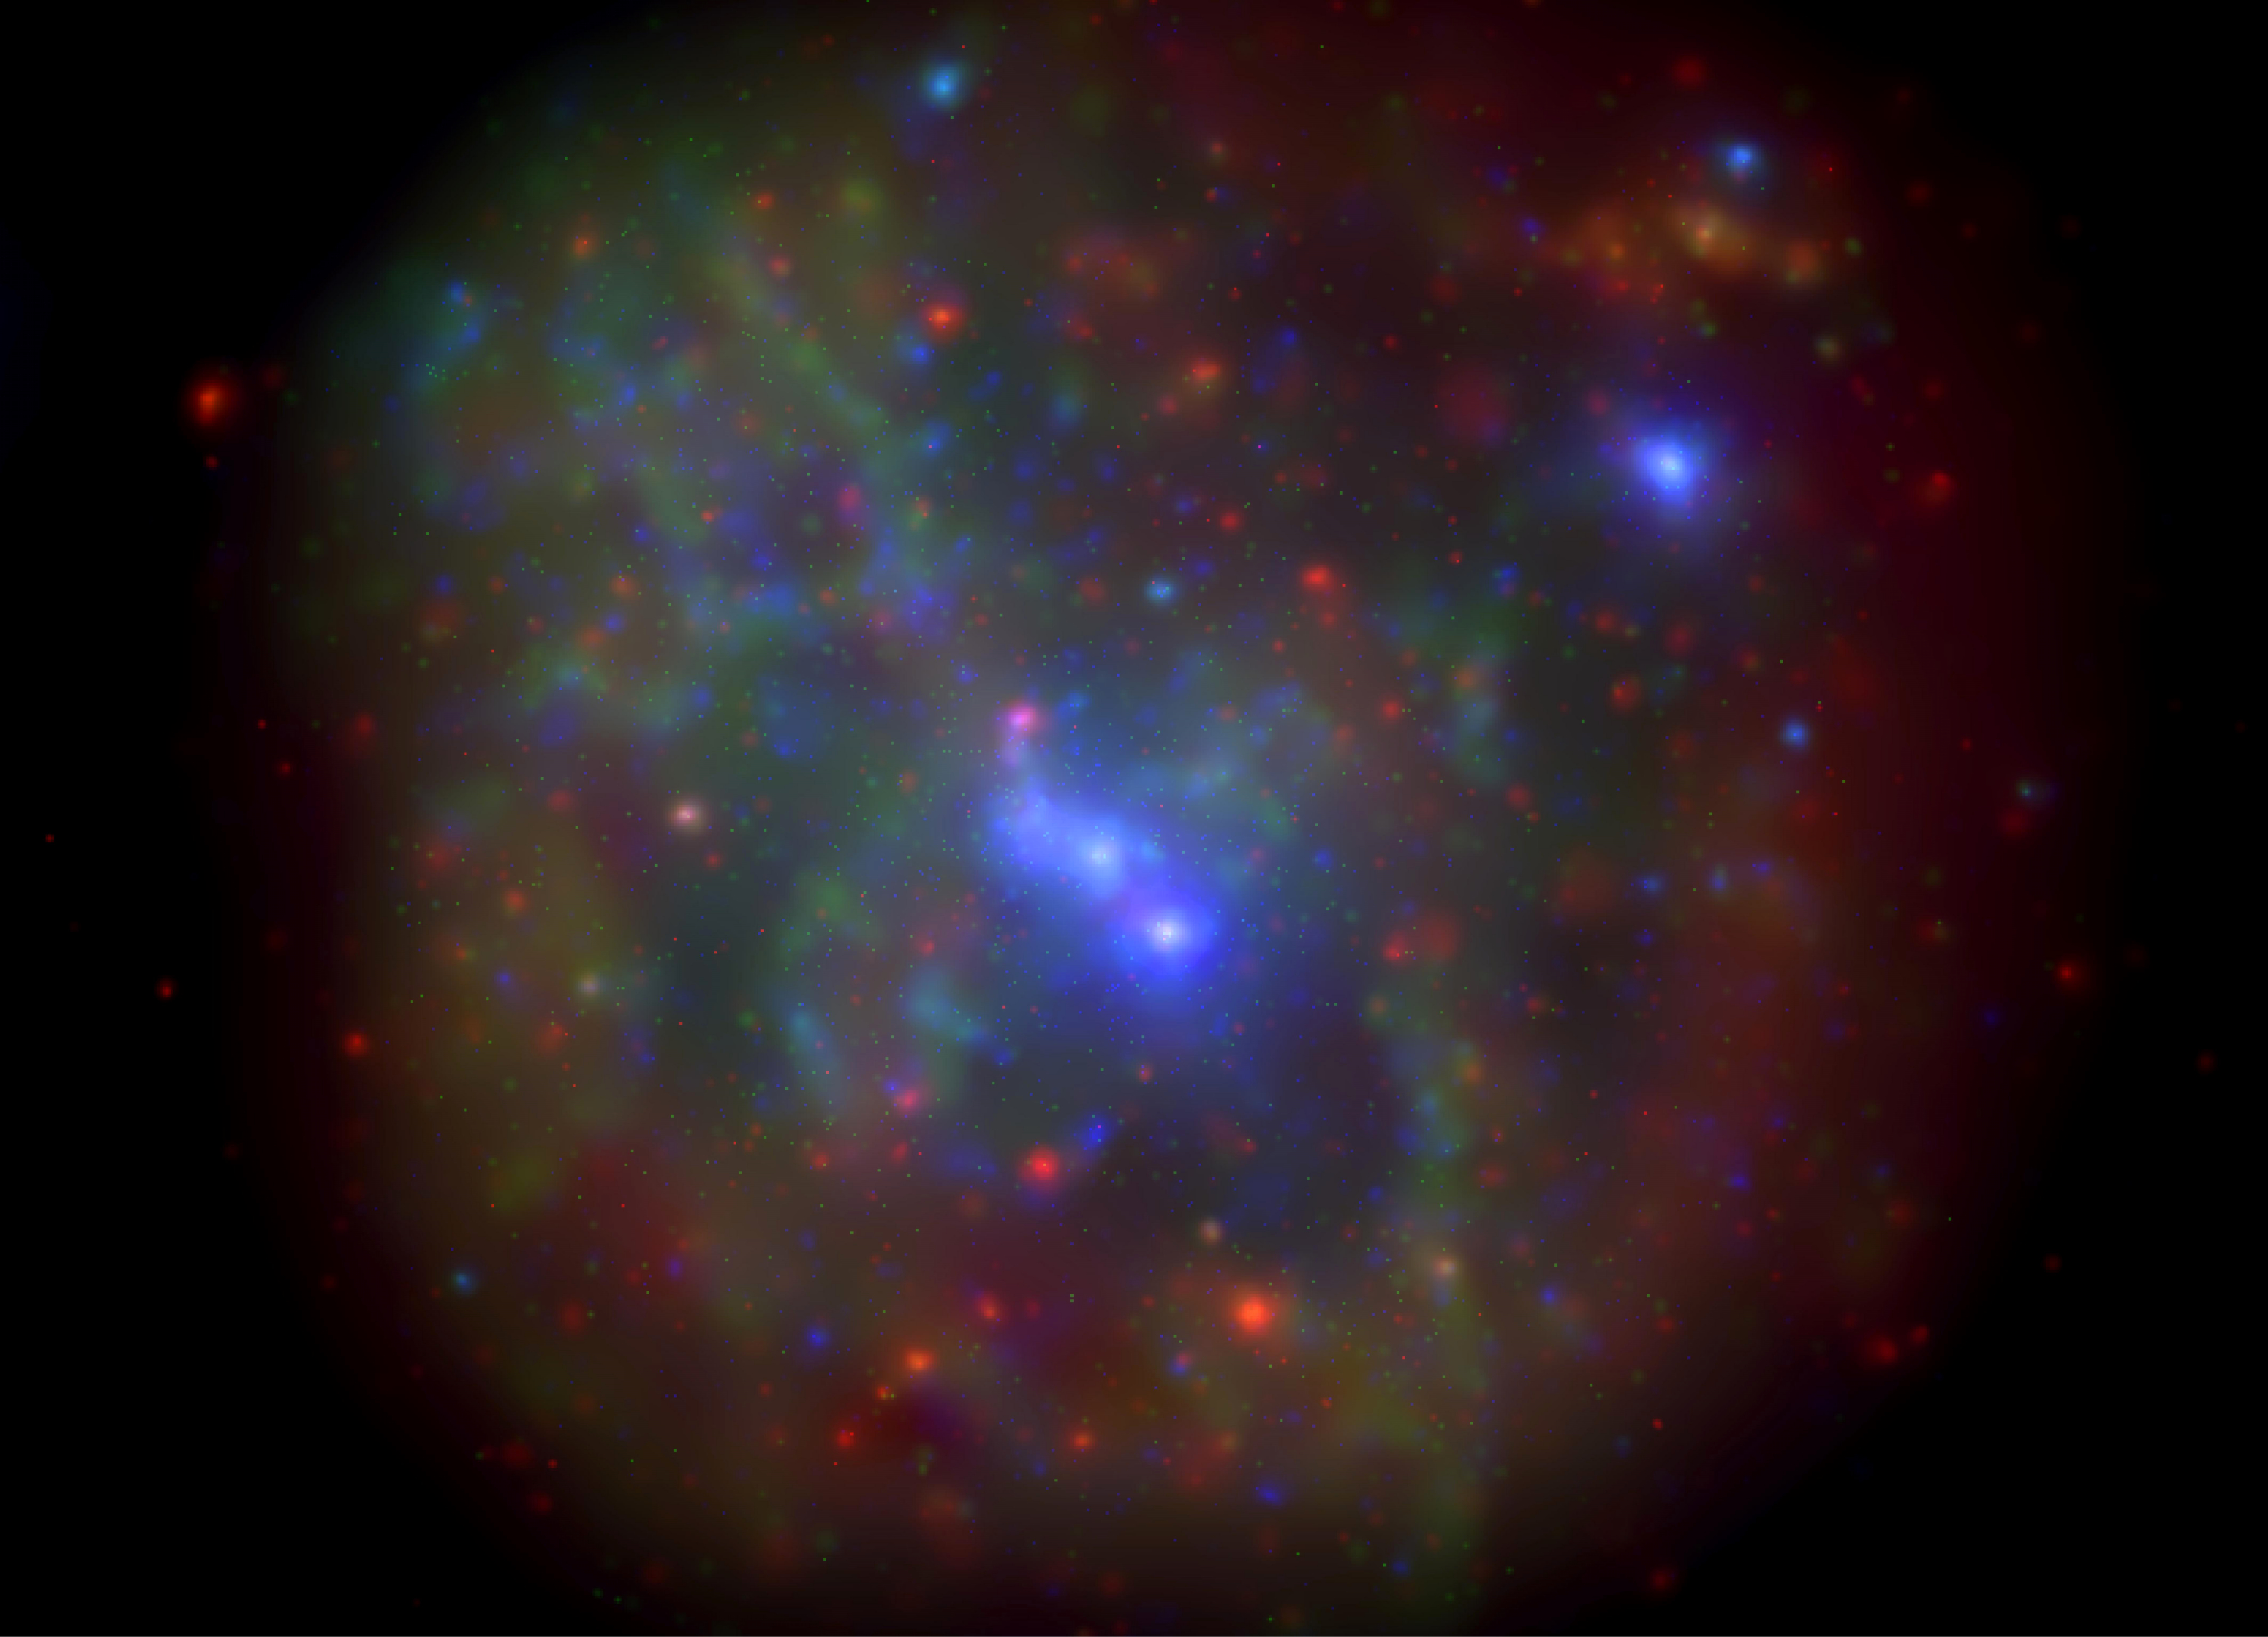
The image on the right represents the summed Swift/XRT image (1.0 Ms) of the inner 15'x15' (~ 35x35 pc) around Sgr A* (mouse over for details), obtained during the Galactic center monitoring campaign in 2006–2013 (0.3–10 keV). The two brightest point sources that are visible in this image correspond to two transient neutron star X-ray binaries (see Degenaar & Wijnands 2009, 2010).
The X-ray flaring properties of Sgr A* during six years of monitoring with Swift: Degenaar et al., (2013).
The Swift X-ray monitoring campaign of the center of the Milky Way: Degenaar et al., (2015).
If you have any questions please contact Nathalie Degenaar (degenaar 'at' uva.nl).
If you would like to receive an automatic update via email when flaring behavior is detected, please email: swift.sgra 'at' gmail.com.
Swift XRT Latest Lightcurve: 24/05/05 @ 02:10:04

SGR J1745-29
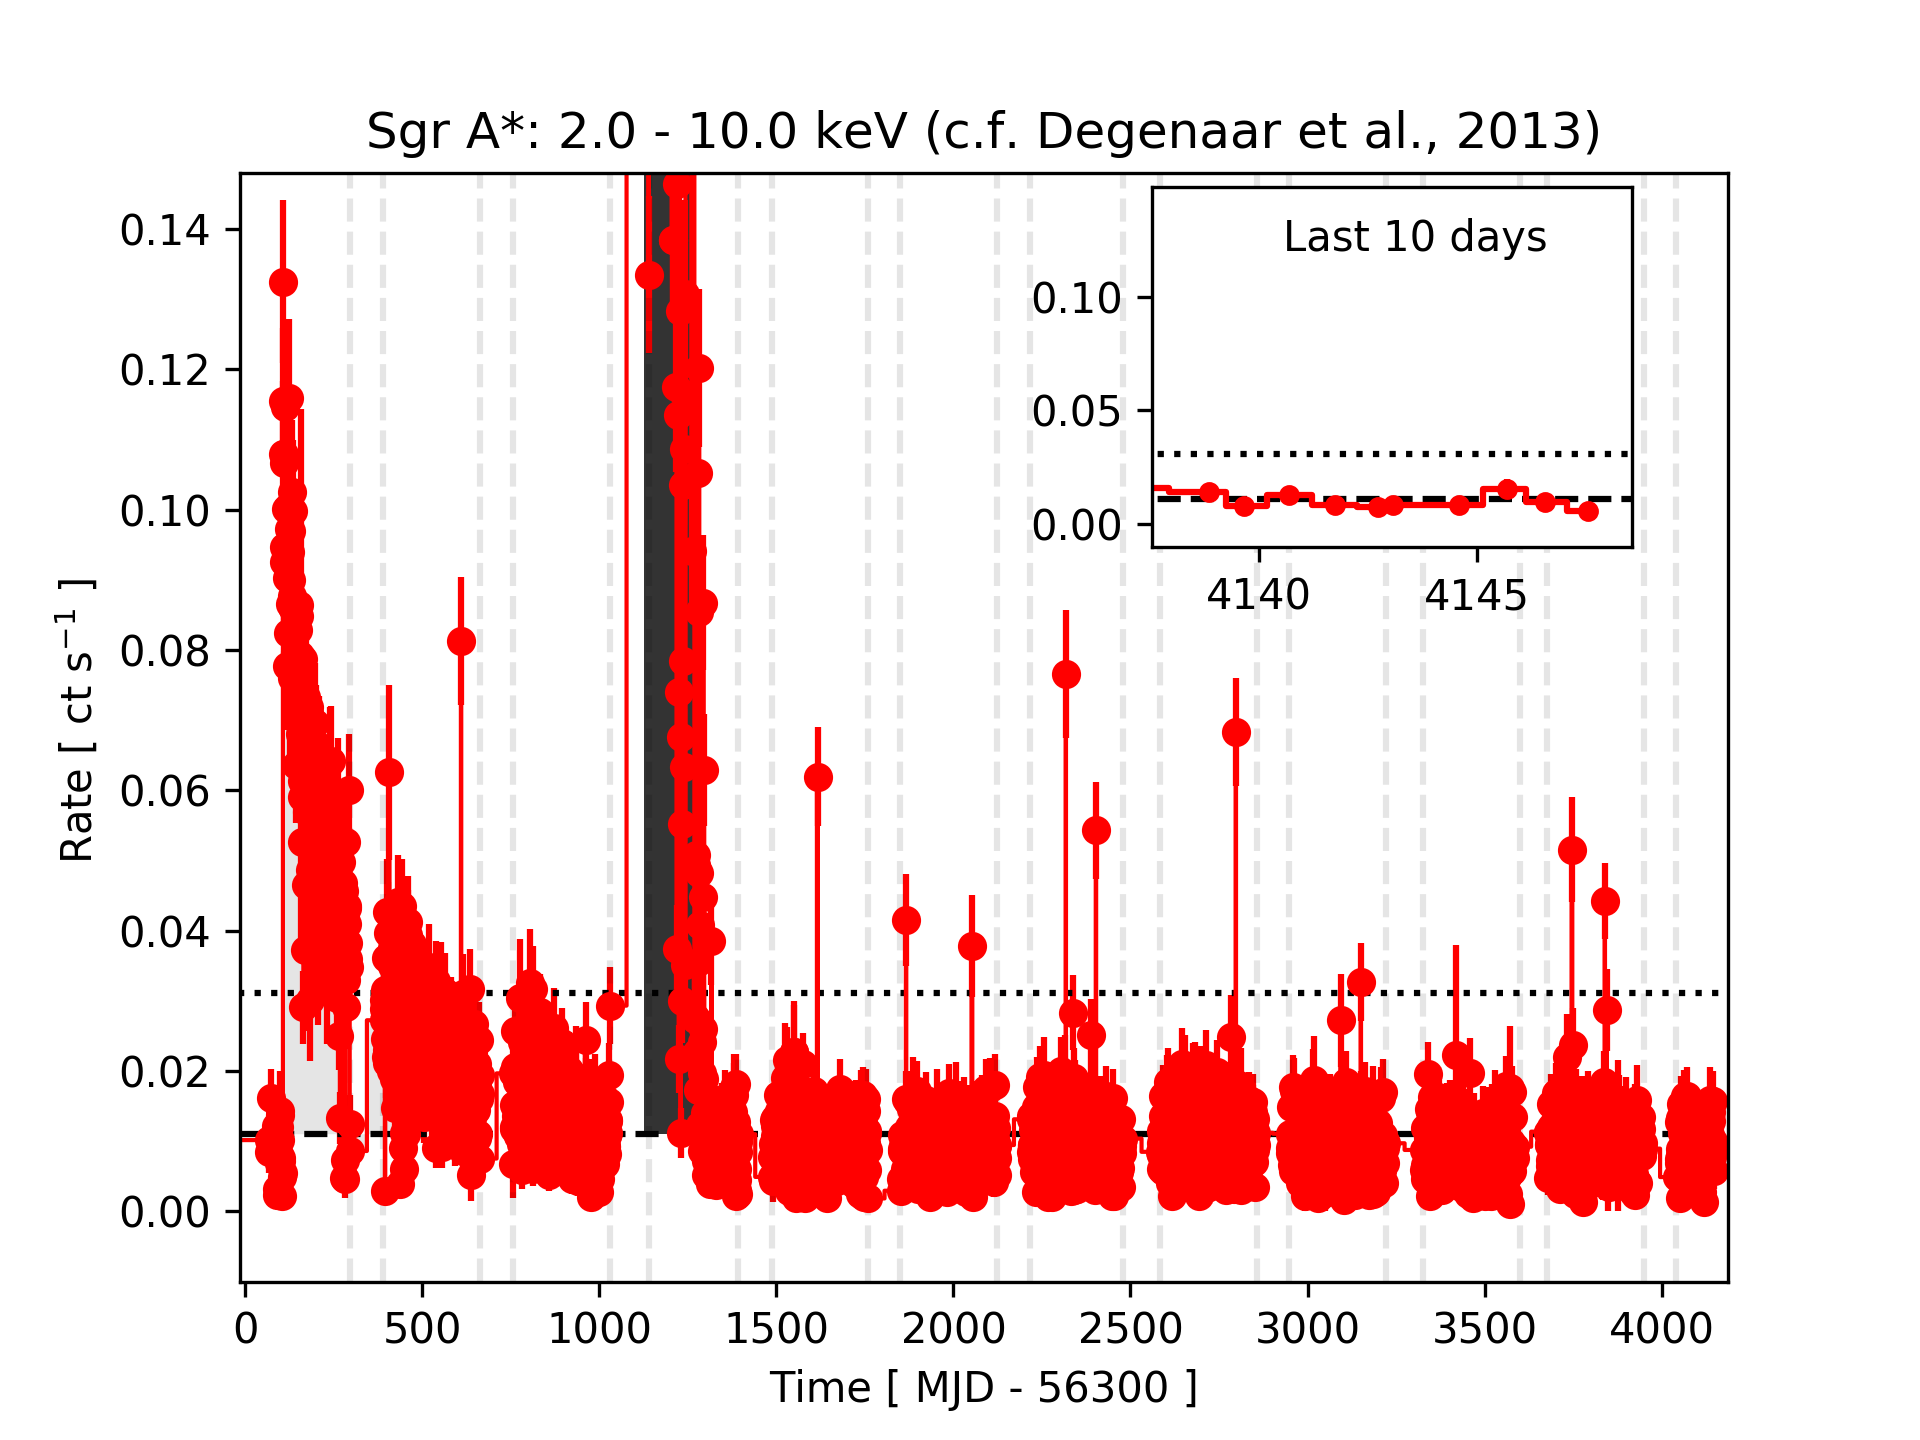
The grey shaded region denotes the April/May 2013 outburst (Degenaar et al. 2013) of a new magnetar, SGR J1745-29, discovered during routine observations as part of our Sgr A* monitoring program. Please see the discovery papers by the Swift (Kennea et al. 2013) and NuStar teams (Mori et al. 2013) for further details on this exciting new transient source.
See also, the Sky & Telescope and Nature News articles regarding this new magnetar.SWIFT J174540.7-290015, SWIFT J174540.2-290037 and SWIFT J174535.5-285921
The black shaded region denotes the 2016 outbursts of the Galactic center transients SWIFT J174540.7-290015 (Reynolds et al. 2016), SWIFT J174540.2-290037 (Degenaar et al. 2016) and SWIFT J174535.5-285921 (Degenaar et al. 2016), discovered during routine observations as part of our Sgr A* monitoring program.
Note: The dips on days ~164/280 are instrumental/analysis artifacts (Reynolds - 140201).Sgr A* lightcurve in the 2.0 - 10.0 keV band. A source extraction region of radius 10'', centered on the radio position is utilized, no background has been subtracted. The dashed line represents the mean count rate measured from 2006-2011 (0.011 ct/s), while the dotted line represents the 3σ excursion from this, see Degenaar et al. (2013) for further details. The vertical dashed lines represent the Galactic center solar constrained window for Swift.
To inspect the long term lightcurve (2006-2012) and additional lightcurve related plots, see here.
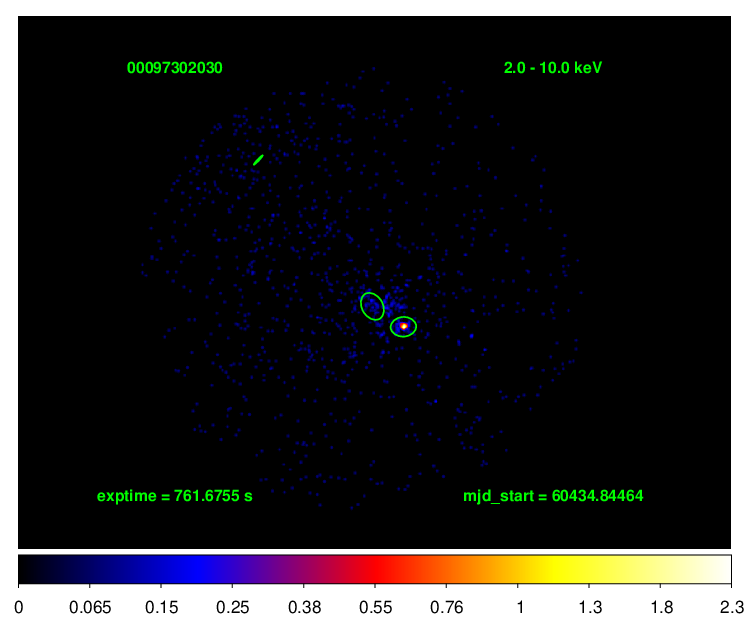
Swift XRT Latest Image: 24/05/05 @ 02:10:04


--------------