KubarychGroup

Multidimensional spectroscopy enables direct measurement of dynamical processes in molecules. A single 2D spectrum tells a much richer story than the corresponding linear one, and the ways in which the 2D spectra change reveal chemical information about reactions, relaxation and interactions with the surroundings.
This introduction briefly covers three topics:
Multidimensional Spectroscopy
Ultrafast Optical “Separation”


In a spectrum with two peaks, how can we tell if the two features arise from two different species or a single one with two different transitions? One way would be to try to do some sort of chemical separation, but doing so would certainly take some time, and we want picosecond or better time resolution.
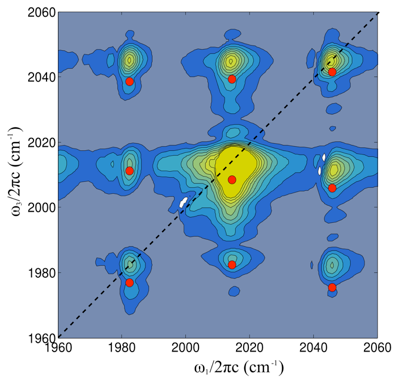
Viewed in a certain way, multidimensional spectroscopy performs an “optical separation.” We plot the excitation frequency on the horizontal axis and the detection frequency on the vertical axis, for a given value of the waiting time between excitation and detection. When two transitions are on different molecules, there will not be a cross peak between them. Contrast the cartoon spectrum with the actual 2DIR spectrum of dimanganese decacarbonyl (far left), where there are many cross peaks.

ωexcite
Spectroscopic “Call-and-Response”


excite
detect
twait
Although the formal underlying theory is rather complicated, the essential information provided by multidimensional spectroscopy is simple. We break the measurement into two periods—an excitation and a detection—with a waiting time period twait in between. The amplitude of the signal is plotted in a 2D contour map which basically tells us the amount of signal at a particular detection frequency ωdetect, given excitation at a particular frequency ωexcite.


excite

