KubarychGroup

2D Lineshape Evolution
Complex environments—like liquids, membranes, protein complexes, etc.—make chemistry really interesting. Environments can slow things down due to friction, but they can also provide much-needed thermal energy to surmount reaction barriers. System-bath interactions have largely been treated with incredibly simple models, and the new experimental methods we use are capable of exposing the inadequacies of these models. One of the basic questions we can ask is: How long does it take a molecule to forget what frequency of light we excited it with? We would like to see how the environment influences that time scale.
Spectral Diffusion
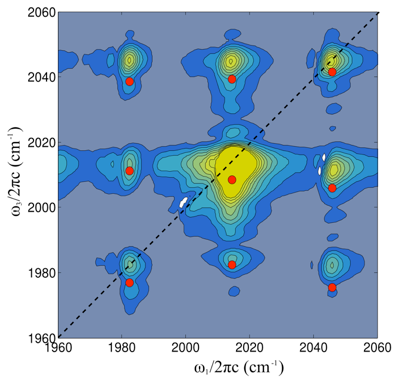
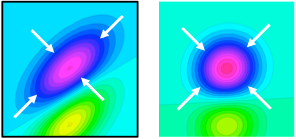
Whereas a linear spectrum cannot uniquely be separated into slow and fast frequency fluctuations, a 2D spectrum can clearly identify the differences. The simulated spectra show that at early waiting time (left spectrum), there is a strong correlation between the excited and detected frequency (the yellow-green part is the v=1-2 transition due to anharmonicity). As the waiting time is lengthened, the initially excited sub-ensembles stochastically sample new configurations, and the correlation is lost. Some measure of the correlation which induces an asymmetry in the 2D lineshape can be used to track the loss of frequency memory in the molecules.
Frequency Fluctuations
When a molecule interacts strongly with its environment, time-dependent fluctuations of the solvent influence the molecule’s internal energy levels. When these fluctuations are relatively slow, the spectroscopic observable can be considered to be in a distinct sub-ensemble of possible configurations, thus having a slightly altered transition energy. As the molecule randomly samples a new configuration, its transition frequency shifts to reflect the new sub-ensemble.
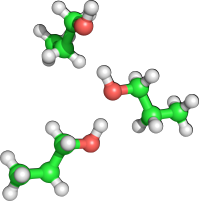
Hydrogen bonded liquids are prototypical examples of systems which undergo slow frequency fluctuations.


twait

ωexcite
ωexcite
