Description
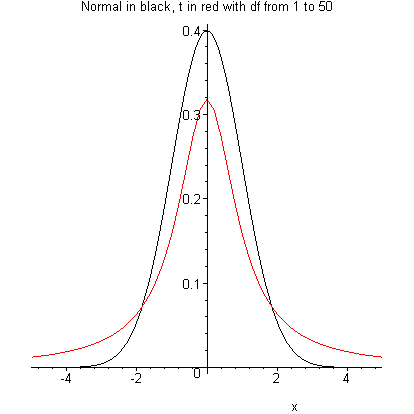
This animation illustrates how the t-distribution aproaches the normal distribution as the degrees of freedom (df) increase from 1 to 50. The animation loops df from 1 to 50.
The animation shows the normal distribution in black and begins with a t-distribution having df=1. The degrees of freedom increase until 50. Initially the t-distribution in red has longer tails than the normal distribution in black. As the animation progresses and the df move from 1 to 50, the shape of the t distribution in red approaches the shape of the normal distribution in black. The tails of the t-distribution get smaller to approach the normal distribution.
Already by df=50 the t-distribution is pretty close to the normal distribution.
The t distribution is indexed by degrees of freedom and tends to have longer tails than the normal distribution.
Richard Gonzalez, University of Michigan
gonzo at umich dot edu
Click here to give feedback on this site or report problems.