Description
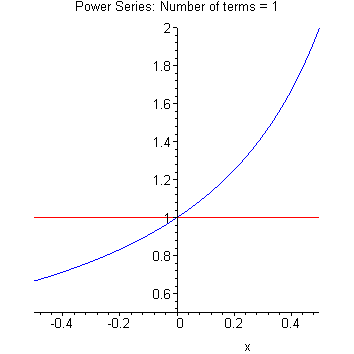
This animation shows how a power series can approach a function. The blue curve is the desired curve to model. The red is the line or curve that occurs as one adds another level. The horizontal means no order (just the intercept value for all values of x). As the number of terms increases the red curvea approximates the blue curve (first a straight line, then a slight curve, then a more pronounced curve, etc until finally the blue curve is well represented). This is another way of showing the usual point that as one makes the model more complicated it is possible to represent information more closely. The standard concern remains, however, as to whether that additional model complexity is overfitting the data.
Richard Gonzalez, University of Michigan
gonzo at umich dot edu
Click here to give feedback on this site or report problems.