Description
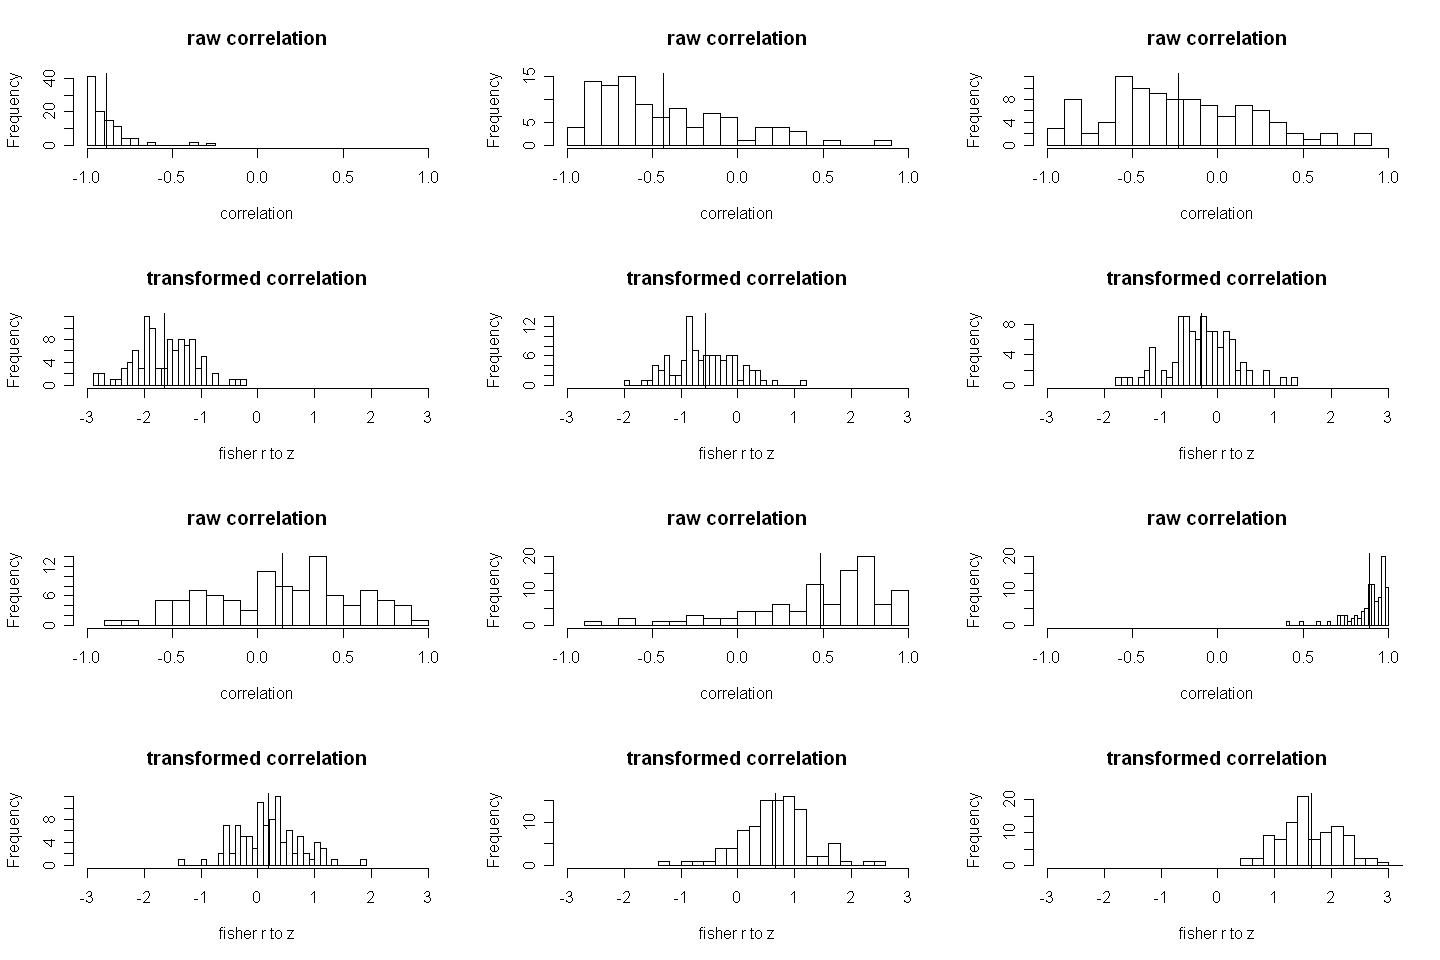
This animation illustrates Fisher's tranformation for correlations in action. The top histogram displays the sampling distribution for the correlation coefficient for different populaton values of the correlation. Note how the histogram is skewed as the population correlation moves from -.99 to +.99, but at a population value of 0 is normally distributed. The lower histogram displays the same information but with the Fisher r to Z tranformation. Note how the histogram is relatively normally distributed throughout the population range of -.99 to +.99. This is the reason that the Fisher transformation for correlations allows significance testing of the correlation for any value of the null hypothesis whereas the raw score test is only applied when the null hypothesis is set at the population correlation value of 0.
Richard Gonzalez, University of Michigan
gonzo at umich dot edu
Click here to give feedback on this site or report problems.