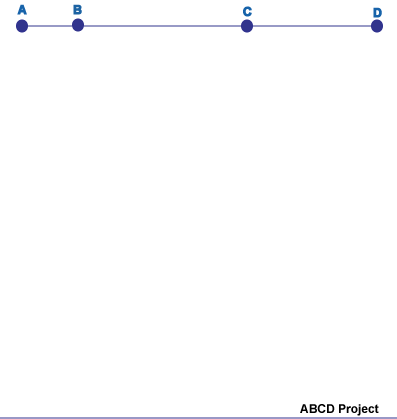
Instructions: Click anywhere on the ABCD line at the top.
Description
This animation shows the constraints imposed by simple rank orders under a standard theoretical representation. The theory follows from early work by University of Michigan's Clyde Coombs. He developed a general theory of data analysis, which had unfolding theory as a special case. Unfolding is a special kind of decision theory that focuses on "ideal points." Coombs' early example involved the number of teaspoons of sugar in a cup of coffee. Imagine a set of 5 cups of coffee arranged in increasing amounts of sugar (0 teaspoons, 1 teaspoon, 2 teaspoons, etc). A particular person has their preferred amount of sugar, their ideal point. Let's assume a person has a preference for 2 teaspoons. The third cup is most preferred. Under unfolding theory, either the cup with 1 or the cup with 2 teaspoons would be ranked in the two spots, depending on whether the person prefers a less sweet than ideal or a more sweet than ideal cup, etc. The intuition for unfolding comes from an infant's mobile. Pick up the mobile at different spots and let the mobile dangle. If one represents the cups of coffee with pieces of paper numbered 0-4 (indicating the number of teaspoons), connects the papers to a string, picks up the string at a point representing the ideal number of teaspoons in one's coffee, the dangling papers will present a rank order from top (most preferred) to bottom (least preferred).
To see how the unfolding model predicts a rank order, click anywhere on the number line and see the "mobile".
The term "unfolding" refers the reverse modeling problem where one observes a rank order and wants to recover the orginal scaling of the objects.
Richard Gonzalez, University of Michigan
gonzo at umich dot edu
Click here to give feedback on this site or report problems.