|
|
Topics
Exemlpar-based Visualization of Large Document Corpus
|
Problem
Definition
-
Information visualization is the interdisciplinary study of the visual representation of large-scale collections
of non-numerical information, such as files and lines of code in software systems, and the use of
graphical techniques to help people understand and analyze data. In contrast with scientific visualization,
information visualization focuses on abstract data sets, such as unstructured text or
points in high-dimensional space, that do not have an inherent 2D or 3D geometrical structure.
Multidimensional projection is a set of related statistical
techniques often used in information visualization for exploring similarities or dissimilarities in data.
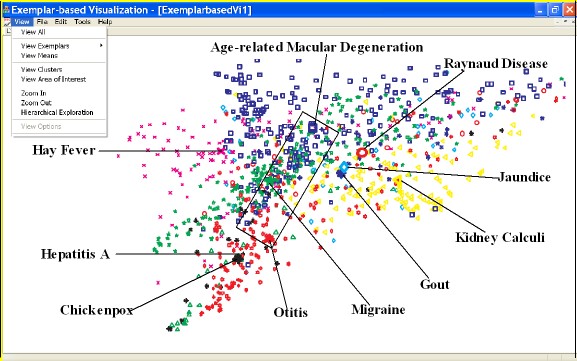
Exemplar-based visualization is to visualize
an extremely large data sets based on multidimensional projection technique, making the visualization highly efficient and flexible.
In addition, the selected data exemplars through matrix approximation and decomposition neatly
summarize the entire data set and greatly reduce the cognitive
overload in the visualization, leading to an easier interpretation of
large data sets.
 |
Algorithms
- Compute a representative text data subspace C (data exemplar set) and a low-rank
approximation X by applying the low-rank matrix approximation
method..
- Data are clustered through the matrix decomposition:
X=CWG^{T} , where W is the weight matrix, and G is the cluster
indicator matrix. The soft cluster indicators G in
the low-rank exemplar subspace, representing the probability of each
data points proportion to the topics (classes).
- Use Parameter Embedding method to embed data into a low-dimensional
Euclidean space such that the input probabilities G are approximated
as closely as possible by the embedding-space probabilities.
Results
- Visualize tens of thousands of documents with high accuracy
(in retaining neighbor relations):
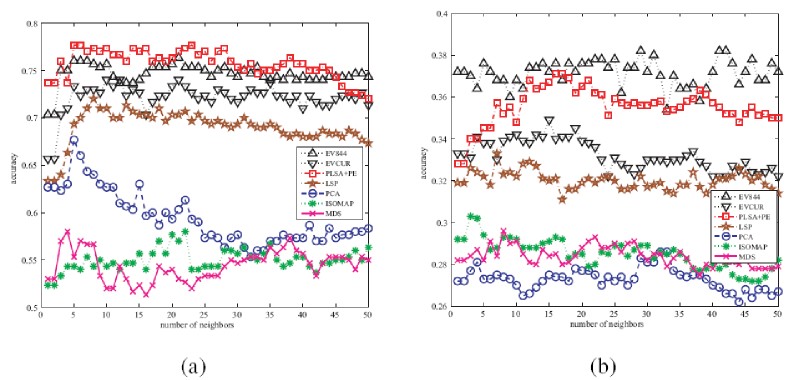
Generally, the AC values obtained by the seven methods are higher
for a small number of topics (e.g., z=3 topics in the following figure (a)) than those with a
large number of topics (e.g., z=20 topics in the following figure 1(b)). Moreover, the accuracy
achieved by the topic models (i.e., EV-844, EV-CUR, PLSA+PE
and LSP) is significantly higher than the traditional projection methods
(i.e., PCA, MDS and ISOMAP). These results indicate that topic
information is very helpful for the data visualization.
Another important
observation from the following sub-figures is that EV-844 constantly provides
a higher accuracy value than EV-CUR. This is mainly because Algorithm
844 selects unique columns (exemplars) while CUR may choose
replicated ones to build the subspace. Finally,
as shown in the figure (a), the two probabilistic topic models (i.e.,
EV and PLSA+PE) have comparable performance on 20Newsgroups-I (3 topics).
However, as the number of topics increases, EV clearly outperforms
PLSA+PE on 20Newsgroups-II (20 topics). These results imply
that EV can appropriately embed documents in a two-dimensional
Euclidean space while keeping the essential relationship of the documents,
especially for a data set with a large number of topics.
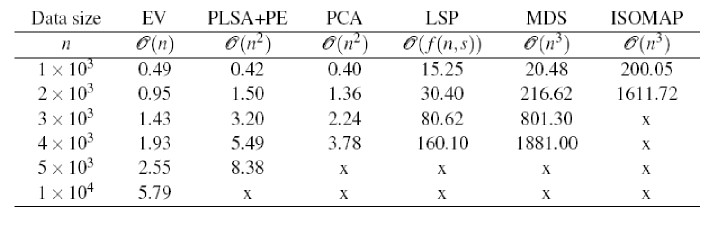
- Visualize tens of thousands of documents with high efficiency (in computation):
We compare the computational speed of the six visualization
methods: EV, PLSA+PE, PCA, LSP, MDS and ISOMAP in the following table. From the table,
EV clearly is the quickest among the six, followed by PLSA+PE
and PCA, while the computing time of LSP, MDS and ISOMAP increases
quickly with the number of documents. More important, we
observed that some algorithms fail to provide a result within a reasonable
time for relatively large document sets. Specifically, ISOMAP is
the slowest and cannot give a result when the matrix contains more
than 3,000 documents due to insufficient memory. When we have
more than 10,000 samples, only EV can provide a result within a reasonable
computation time, while all other methods fail (indicated by
a cross x in the table). Clearly, EV is suitable to visualize large text
corpus we are increasingly facing these days thanks to its high computational
efficiency.
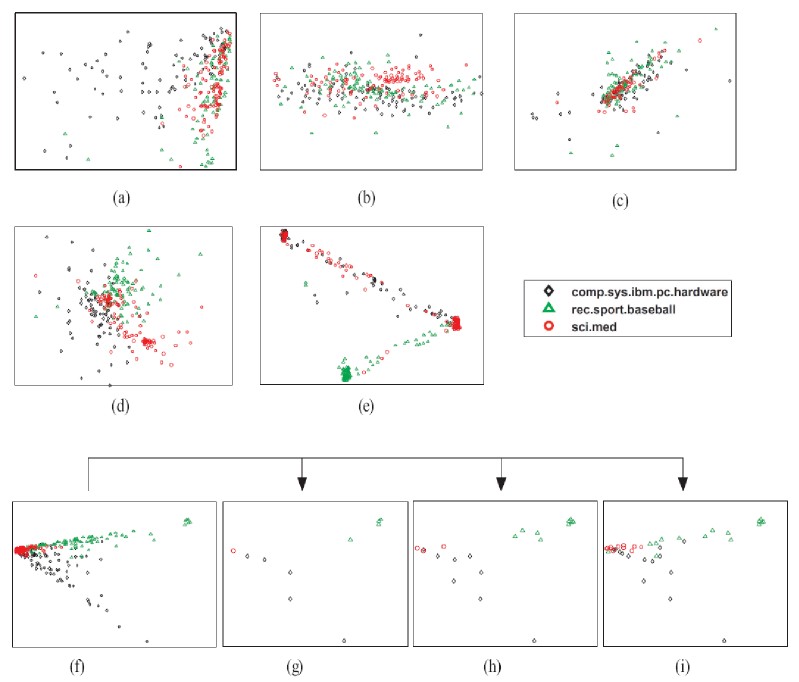
- Visualize tens of thousands of documents with high flexibility (through the use of exemplars):
The following figure shows the visualization results obtained by EV,
PLSA+PE, LSP, ISOMAP, MDS, and PCA on 20Newsgroups-I (subset of 20Newsgroups). Here, each point represents a document,
and the different color shapes represent the topic labels. For
example, there are three different color shapes in this figure, representing
three groups of news: black diamond for "comp.sys.ibm.pc", green
triangle for "rec.sport.baseball" and red circle for "sci.med". In the EV
visualization (figure (f)), documents with the same label are nicely
clustered together while documents with different labels tend to be
placed far away. In PLSA+PE and LSP (figures (e) and (d)), documents
are located slightly more mixed than those in EV. On the other
hand, with PCA, MDS and ISOMAP (figures (a)-(c)), documents
with different labels are mixed, and thus the AC values of the corresponding
layout are very low. Also, the figures (g)-(i), a series
of visualization for 20Newsgroups-I are provided, from the most abstract view
to the visual layout with considerate amount of details as the number
of selected exemplars increases from 10 to 40. This result demonstrates
that EV can use exemplars to summarize the distribution of
the entire document collection.
 |
Related Publications
- Yanhua Chen, Lijun Wang, Ming Dong and Jing Hua,
"Exemplar-based Visualization of Large Document Corpus",
accepted by IEEE Information Visualization Conference (IEEE InfoVis),
Atlantic City, NJ, USA, 2009 (acceptance rate = 26%, the journal version appeared in
IEEE Transactions on Visualization and Computer Graphics (TVCG),
Vol. 15, No. 6, pp. 1161-1168, November/December 2009).
|
|
| |