| Further Notes on Survey
Research 1. Introduction 2. Sampling 3. Measures and Indicators 4. Constructing Questionnaires |
Urban
Planning 504: Quantitative Planning Methods
Prof. Campbell University Of Michigan last modified: Monday, March 3, 2008 1:12 PM |
Other Links
Some sources and readings on survey research:
course electronic reserve readings:
Babbie, Earl. "Ch. 4 Research Design, Ch. 5 Conceptualization, Operationalization and Measurement" in The Practice of Social Research. 9th edition, Belmont, CA: Wadsworth, 2003, pp. 90 - 147. [pdf]
Fowler, Floyd. "Sampling," in Survey Research Methods. 2nd edition, Sage, 1993, pp. 10-37. [pdf]
Nishikawa, Nancy . "Ch 2: Survey Methods for planners," in The Planner’s use of information, edited by Hemalata C. Dandekar Chicago, IL: American Planning Association, 2003, pp. 51-78. [pdf]
see also:
Babbie, Earl. 1994. The Practice of Social Research.
7th ed. Belmont, CA: Wadsworth.
Bailey, Kenneth D. 1987. Methods of Social Research.
3rd ed. New York: Free Press.
Dillman, Don A. 1978. Mail and Telephone Surveys.
New York: Wiley.
Fowler, Floyd J. Jr. 1993. Survey Research Methods.
Beverly Hills: Sage Publications.
![]()
| 1.
Introduction to Survey Research |
| Survey Research -- a form
of observation
Why sometimes seen as boring:
|
Some basic terms:
primary data: data that you collect (e.g., through a survey, an interview, etc.) -- that is, collecting original data. secondary data: data that has already been collected by someone else (e.g., the US Census) census: "(1) a count of the population and a property evaluation in early Rome; (2) a usually complete enumeration of a population..." (Merriam Webster's 10th) sample: [ME, fr. MF essample, fr. L exemplum -- more at EXAMPLE] "(1) a representative part of a single item from a larger whole or group esp. when presented for inspection or shown as evidence of quality: SPECIMEN (2) a finite part of a statistical population whose properties are studied to gain information about the whole" (Merriam Webster's 10th) sample
(N) vs. population (M)
|
| The Culture of survey
research:
Conducting a survey is a form of communicative
inquiry -- of asking questions.
as a result, survey research is both a science and a social activity (a dialogue), and cannot be easily exported from one place to another. Examples:
|
Key Themes:
you want to know the framework of results before you start designing the questionnaire. Avoid asking questions without knowing what you will do with the answers. Surveys should start with clear research and policy questions. |
| Steps of Survey Research:
A Hypothetical Survey Research Schedule Q Questionnaire
Construction |
Ways to
Administer Surveys:
This will shape your questionnaire, as well as
your sample.
| How the Questionnaire gets to the Respondent:
a. in-person survey b. mail c. telephone d. internet |
How they answer the questionnaire:
1. self-administered 2. administered by staff |
see also Trochim
on the plus and minus of survey methods
![]() Some Advantages and Difficulties
with Each Approach (ordered from low to high-tech)
Some Advantages and Difficulties
with Each Approach (ordered from low to high-tech)
| In-person | Mail Survey | telephone | internet | |
| Advantages |
|
|
|
|
| Difficulties |
|
|
|
|
![]() Which way would you recommend
administering each survey below?
Which way would you recommend
administering each survey below?
| Population | Topic | Mail Survey | In-person | telephone | internet |
| homeless in New York City | their diet and eating habits | no | yes | no | no |
| New Yorkers | their view of the homelessness | yes | yes | best? | ? |
| U.S. city planners | their use of computers | yes | yes | yes | best? |
| typical Americans | reactions to the recent bombings in Afghanistan | too slow? | yes | yes | no? |
| prisoners | prison life | yes | yes | ? | no |
| New York subway riders | crime on the subway | ||||
| Chicago residents | attitude about the Sears Tower | ||||
| Chicago residents | attitude about a new proposed skyscraper design | ||||
| 8-year-old children in Ann Arbor | their favorite public places to play | ||||
| 8-year-old children in Mozambique | their favorite public places to play | ||||
| college students | their feelings about racism | ||||
| Muscovites | their views on Putin and democracy in Russia | ||||
| U.S. Senators | their support of recycling laws | ||||
| married women | their fear of violence from their husbands | ||||
| college students | their recognition of 100 book titles |
| 2.
Sampling |
Why Sample?
less people interviewed means a lower profile for the the research project (which can be useful). |
Terms: unit of analysis sample randomness sampling element - the unit about which information is collected (similar to unit of analysis. sampling element refers to sample selection; unit of analysis refers to the analysis stage). sampling frame - the list of units from the population from which a sample is selected. population - the theoretically specified aggregation of study elements. study population - the aggregation of elements from which the sample is selected. (usually somewhat smaller than the population because not every element of the population has a chance to being selected.) sample size response rate - the number of persons participating in the survey as a percent of the total sample size. for example: the percentage of questionnaires that are returned. respondent - a person who responds to a survey, e.g., by completing a questionnaire. sampling error - inaccuracy in moving from sample observations to population parameters. weighted samples - sampling where there is an unequal but known chance of each element being selected. (each case is then assigned a "weight" to adjust for these unequal chances). The weight is proportional to the number of persons in the population that the individual case represents. bias - "systematic error introduced into sampling or testing by selecting or encouraging one outcome or answer over another." (Merriam Webster's 10th) |
![]() What is Sampling Based on?
The Concepts of Probability and Randomness
What is Sampling Based on?
The Concepts of Probability and Randomness
that is, the probability of each individual
being included in the sample.
We assume that randomness (random sampling)
creates an equal chance of each element being selected.
| A sample will be representative if all members of the population have an equal chance of being picked. |
Sample Size
depends on:
![]() Sampling Fraction -- or -- why
do we usually just care about the sample size, not the population size?
Sampling Fraction -- or -- why
do we usually just care about the sample size, not the population size?
sample (N)
vs. population (M)
sampling fraction =
N/M
the actual formula for the standard error (standard deviation of the sampling distribution) is:
![]()
where f = sampling fraction = N / M
but since typically M >> N
then f --> 0
so 1-f becomes 1, and so the formula for the standard error becomes:
![]()
Comparison of Corrected and Uncorrected Standard Error
Calculations of a Hypothetical Population of 38,000 (and standard deviation
of 20,000).
|
sample size (n)
|
Population size (m)
|
sampling fraction (f)
|
standard deviation of the sample
|
std error (corrected)
|
std error (uncorrected)
|
Percent difference between corrected
and uncorrected standard error
|
|
1
|
38,000
|
0.00003
|
20,000
|
19999.7
|
20000.0
|
0.00%
|
|
100
|
38,000
|
0.00263
|
20,000
|
1997.4
|
2000.0
|
0.13%
|
|
200
|
38,000
|
0.00526
|
20,000
|
1410.5
|
1414.2
|
0.26%
|
|
400
|
38,000
|
0.01053
|
20,000
|
994.7
|
1000.0
|
0.53%
|
|
800
|
38,000
|
0.02105
|
20,000
|
699.6
|
707.1
|
1.06%
|
|
1,600
|
38,000
|
0.04211
|
20,000
|
489.4
|
500.0
|
2.13%
|
|
3,200
|
38,000
|
0.08421
|
20,000
|
338.3
|
353.6
|
4.30%
|
|
6,400
|
38,000
|
0.16842
|
20,000
|
228.0
|
250.0
|
8.81%
|
|
12,800
|
38,000
|
0.33684
|
20,000
|
144.0
|
176.8
|
18.57%
|
|
25,600
|
38,000
|
0.67368
|
20,000
|
71.4
|
125.0
|
42.88%
|
|
37,999
|
38,000
|
0.99997
|
20,000
|
0.5
|
102.6
|
99.49%
|
|
38,000
|
38,000
|
1.00000
|
20,000
|
0.0
|
102.6
|
100.00%
|
Note that there is very little difference in using the corrected vs. uncorrected standard error until the sampling fraction gets large. For example, even with a sample of 800 (out of a total population of 38,000), the difference is only 1 percent. The two estimates of standard error only begin to deviate significantly when the sample size is more than several thousand (that is, when the sampling fraction approaches about 10% or more).
Moral of the story: it is
fine -- and more conservative -- to use the uncorrected estimate, which is easier
to calculate anyway.
| Level | Definition | Example |
| Study Population | the aggregation of elements from which the sample is selected. | American city planners |
| Sampling Frame | the actual list of units from the population from which a sample is selected | the 1999 membership list from the American Planning Association |
| Sample | the collection of elements selected | the 200 members selected from the list |
| Sampling Elements (cases) | the individual elements | the individual (the APA member) |
| "A sample cannot be more
accurate than the sampling frame from which it is drawn." (Bailey, p. 84)
AND: you CANNOT overcome this inaccuracy through increasing the sample size. |
| EXAMPLE: if interviewing 40 people on the street at midnight (the sampling frame) about their social life leads to a biased sample (over selection of people with an active social life -- or else insomniacs), then increasing the sample size to 200 people (at midnight) will not overcome this initial bias. |
| The critical question to ask is: WHO did NOT response to the survey, and how are these people different from those that did answer? The more the reasons for why someone responded (or didn't) are correlated to the variables in your survey, the more your sampling strategy will introduce biases into the results. |
| EXAMPLE: doing
an online survey about how comfortable and familiar people are with technology
will clearly lead to a biased outcome (since the criterion for being included
in the sampling frame is highly correlated to the questions -- and thus
your variables -- in the survey).
HOWEVER: you would likely have less bias with this sampling frame if your variables are less correlated to the selection criterion: e.g., whether they own a dog or cat. Yet there may be in fact a relationship between pet ownership and computer use, which you would only know if you could also survey non computer users. The ideal is to use selection criteria that are orthogonal (statistically independent) with the variables in the questionnaire. So: it is always safest to start with a non biased sampling frame. |
A door-to-door survey was conducted in various U.S. suburban areas.
One survey question was: "Would you prefer to live in a higher density
town with more public transit, more front porches, more walkable space, even
if it means smaller houses and lots?"
In the population as a whole, 25 percent would have answered yes.
Can we know how biased the respondent sample will be as compared to the
population as a whole?
Answer? Only if we can know (or at least estimate) the preferences
of the nonrespondents and of the population as a whole.
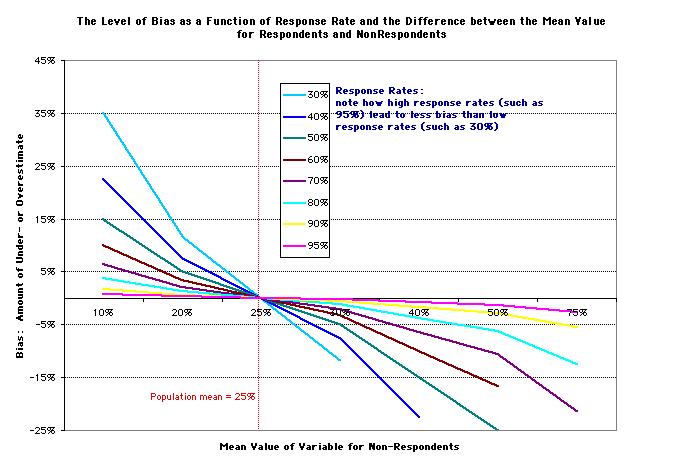
Example: Given a specific response rate (e.g.,
80%) and knowledge of both nonrespondent preferences
(e.g., 40%) and the total population's preferences
(25%), we can know what the respondent sample mean will be (21%),
and thus how biased this is (4% too low).
Respondent sample mean as a function of Response
Rate and Percent of Non-Respondents
who would prefer the higher density town (if the population mean = (µ
= 25%)
| Percent of Non-Respondents who would prefer the higher density town (µ = 25%) | ||||||||||
|
|
10%
|
20%
|
25%
|
30%
|
40%
|
50%
|
75%
|
|||
|
|
26%
|
25%
|
25%
|
25%
|
24%
|
24%
|
22%
|
high response rate | ||
|
|
27%
|
26%
|
25%
|
24%
|
23%
|
22%
|
19%
|
|||
|
|
29%
|
26%
|
25%
|
24%
|
21%
|
19%
|
13%
|
|||
|
|
31%
|
27%
|
25%
|
23%
|
19%
|
14%
|
4%
|
|||
|
|
35%
|
28%
|
25%
|
22%
|
15%
|
8%
|
||||
|
|
40%
|
30%
|
25%
|
20%
|
10%
|
0%
|
||||
|
|
48%
|
33%
|
25%
|
18%
|
3%
|
|||||
|
|
60%
|
37%
|
25%
|
13%
|
low response rate | |||||
|
no bias
|
||||||||||
One can express this table as a graph:
for more information on non-responses, see papers
from the International Conference on Survey Nonresponse 1999
Two Approaches to Sampling:
| examples of probability sampling | examples of nonprobability sampling |
| simple random
systematic sampling stratified random sampling cluster sampling |
convenience
quota sampling dimensional sampling purposive sampling snowball sampling |
simple
random sample (sampling without replacement -- that is, no-one can be picked
twice)
Construct a list (a sampling
frame) of the study population and randomly select, say, 100 individuals.
Each person, regardless of groupings, has an equal chance of being selected.
this is the ideal type; but often hard to
achieve. It sounds easier than it is to do.
Why? can you directly obtain a sampling frame?
(an actual list of sampling units). Sometimes it doesn't exist,
and to create it would be a terribly massive, frustrating undertaking.
Example: how would you randomly sample
and interview 50 people who might shop at Krogers over a given day using random
sampling.
or: randomly sample 100 Americans (would
require a list of 274 million names).
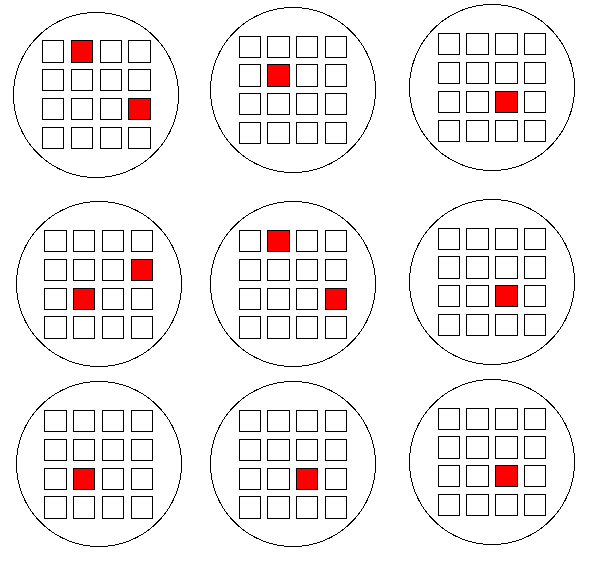
A simple random sample of 20 cases
|
1
|
2
|
3
|
4
|
5
|
6
|
7
|
8
|
9
|
10
|
|
11
|
12
|
13
|
14
|
15
|
16
|
17
|
18
|
19
|
20
|
|
21
|
22
|
23
|
24
|
25
|
26
|
27
|
28
|
29
|
30
|
|
31
|
32
|
33
|
34
|
35
|
36
|
37
|
38
|
39
|
40
|
|
41
|
42
|
43
|
44
|
45
|
46
|
47
|
48
|
49
|
50
|
|
51
|
52
|
53
|
54
|
55
|
56
|
57
|
58
|
59
|
60
|
|
61
|
62
|
63
|
64
|
65
|
66
|
67
|
68
|
69
|
70
|
|
71
|
72
|
73
|
74
|
75
|
76
|
77
|
78
|
79
|
80
|
|
81
|
82
|
83
|
84
|
85
|
86
|
87
|
88
|
89
|
90
|
|
91
|
92
|
93
|
94
|
95
|
96
|
97
|
98
|
99
|
100
|
|
101
|
102
|
103
|
104
|
105
|
106
|
107
|
108
|
109
|
110
|
|
111
|
112
|
113
|
114
|
115
|
116
|
117
|
118
|
119
|
120
|
|
121
|
122
|
123
|
124
|
125
|
126
|
127
|
128
|
129
|
130
|
|
131
|
132
|
133
|
134
|
135
|
136
|
137
|
138
|
139
|
140
|
|
141
|
142
|
143
|
144
|
145
|
146
|
147
|
148
|
149
|
150
|
|
151
|
152
|
153
|
154
|
155
|
156
|
157
|
158
|
159
|
160
|
|
161
|
162
|
163
|
164
|
165
|
166
|
167
|
168
|
169
|
170
|
|
171
|
172
|
173
|
174
|
175
|
176
|
177
|
178
|
179
|
180
|
|
181
|
182
|
183
|
184
|
185
|
186
|
187
|
188
|
189
|
190
|
|
191
|
192
|
193
|
194
|
195
|
196
|
197
|
198
|
199
|
200
|
A systematic random sample of 20 cases
|
1
|
2
|
3
|
4
|
5
|
6
|
7
|
8
|
9
|
10
|
|
11
|
12
|
13
|
14
|
15
|
16
|
17
|
18
|
19
|
20
|
|
21
|
22
|
23
|
24
|
25
|
26
|
27
|
28
|
29
|
30
|
|
31
|
32
|
33
|
34
|
35
|
36
|
37
|
38
|
39
|
40
|
|
41
|
42
|
43
|
44
|
45
|
46
|
47
|
48
|
49
|
50
|
|
51
|
52
|
53
|
54
|
55
|
56
|
57
|
58
|
59
|
60
|
|
61
|
62
|
63
|
64
|
65
|
66
|
67
|
68
|
69
|
70
|
|
71
|
72
|
73
|
74
|
75
|
76
|
77
|
78
|
79
|
80
|
|
81
|
82
|
83
|
84
|
85
|
86
|
87
|
88
|
89
|
90
|
|
91
|
92
|
93
|
94
|
95
|
96
|
97
|
98
|
99
|
100
|
|
101
|
102
|
103
|
104
|
105
|
106
|
107
|
108
|
109
|
110
|
|
111
|
112
|
113
|
114
|
115
|
116
|
117
|
118
|
119
|
120
|
|
121
|
122
|
123
|
124
|
125
|
126
|
127
|
128
|
129
|
130
|
|
131
|
132
|
133
|
134
|
135
|
136
|
137
|
138
|
139
|
140
|
|
141
|
142
|
143
|
144
|
145
|
146
|
147
|
148
|
149
|
150
|
|
151
|
152
|
153
|
154
|
155
|
156
|
157
|
158
|
159
|
160
|
|
161
|
162
|
163
|
164
|
165
|
166
|
167
|
168
|
169
|
170
|
|
171
|
172
|
173
|
174
|
175
|
176
|
177
|
178
|
179
|
180
|
|
181
|
182
|
183
|
184
|
185
|
186
|
187
|
188
|
189
|
190
|
|
191
|
192
|
193
|
194
|
195
|
196
|
197
|
198
|
199
|
200
|
Over sampling leads to weighted
samples, thus the use of weights.
The weight is proportional to the number of individuals
in the population as a whole that each case in the sample "represents."
If you see weights for each case in a data set,
that is an indication of a stratified survey with differential probabilities
of each case being selected.
(Don't ignore the weights -- otherwise you will
create biased estimates of the population.)
Stratified Sampling can also lower
sampling error,
but only when the variable(s) used to stratify
the data (e.g., faculty rank) are statistically related to the variables in
the sample (e.g., faculty salaries).
Example: use of weighted stratified sampling
a survey of planners, doctors and robbers in New York City.Since planners and robbers both small subgroups of the population, a simple random sample would lead to only about 15 planners and 60 robbers included in the sample (too small to make accurate inferences about these subgroups -- especially planners)
Solution?
Divide into 3 occupational strata and over sample planners and robbers. Since each strata has a different probability of being selected, use weights to adjust before aggregating to the population as a whole.Visually, the 3 strata can be visualized as follows:
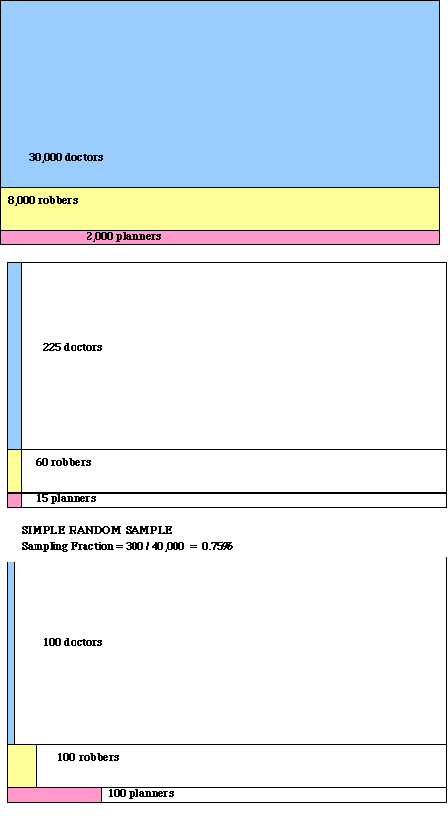
0 ------ percent of each strata in sample ------>>> 100%Above, one sees the effect of over-sampling planners (and undersampling doctors)
In table form:
Population Simple Random Sample (unstratified) n=300) Stratified Sample n=300 Probability of Selection in Stratified Sample Weight = 1 / probability of being selected Planners 2,000 15 100 100/2000 = .05 20 Doctors 30,000 225 100 100/30000 = .0033 300 Robbers 8,000 60 100 100/8000 = .0125 80 TOTAL 40,000 300 300 --- --- How to interpret weights? Each planner in the sample represents 20 planners in the population as a whole, while each sampled doctor represents 300 doctors in the population as a whole.
If you see survey data where all the cases have weights = 1, then no disproportional sampling.
Example: Imagine that you wanted to
conduct in-person interviews with neighborhood organizations.
There are 9 cities scattered around the country
with the relevant types of organizations, and 16 organizations within each of
the 9 cities (or 144 total organizations). You need to interview 12 organizations.
A simple random sample would likely require interviews in (and this travel to)
these 9 distant cities:
If you used multi-stage clustered sampling,
you would first randomly select a certain number of cities (here three), and
then randomly select four organizations within each of the three cities.
This saves travel time, and also makes it easier to assemble a sampling frame
(a list of the ultimate sampling elements).

| AN UNUSUALLY COMPLICATED
EXAMPLE: from United States to 8 states to 4 counties within each state to 4 school districts within each county to 4 schools within each district to 3 classrooms within each school to 5 students within each classroom. (TOTAL number of sampling elements = 8 x 4 x 4 x 4 x 3 x 5 = 7680 students. each stage of sampling leads to the selection of a sampling unit (e.g., states, cities, schools). the final stage is the actual selection of the sampling elements (school students). |
Each stage also introduces sampling error (the chance that you might happen to pick the more urban states, the poorer counties, the richer schools, the brighter students, etc.). With random sampling at 6 different stages, the chance for error is quite high. To reduce this, you might reduce the number of stages. For example: go right from states to districts, and from districts to schools, and from schools to students. Use only as many stages as needed to obtain the sampling frame.
So: a trade-off: clustered sampling
makes some kind of survey research possible or at least easier, but you sacrifice
some accuracy.
| stratified sampling | cluster sampling | |
| is a sampling frame directly available? | yes. (always?) | No (that is a key reason why you use it). |
| which groups are sampled from? | ALL groups | only selected groups |
| Advantages | allows for over sampling (and thus greater
accuracy) of underrepresented groups (by weighted sampling), thus keeping
the overall sample size small. can sometimes lower error |
allows for the surveying of individuals even
when there no sampling frame available. thus can save time and money |
| Disadvantages | more complex (multi-stages; use of weights) | more complex each stage of random sampling introduces possible error. |
| Ideal situation | high variation across strata low variation within strata |
low variation across clusters high variation within clusters |
| Example | a survey of U-M students: first divide into strata (freshmen, sophomore, Junior, senior, Masters students, doctoral students). Then take a random sample from each strata. | a survey of college students nation-wide: (1) first randomly select, say, 6 states; (2) then randomly select 5 colleges from each state; (3) then construct sampling frames from each of the 5 x 6 = 30 colleges and randomly select 25 students from each list. (total: 750 students). |
| Advantages over Simple Random Sampling | lower sampling error; greater representation of small strata. | often no sampling frame available for simple random sampling (e.g., a
single list of college students nationwide) because cluster sampling can "cluster" the sampling units into geographic clusters, one would only need to travel to (in our example) to 6 states, rather than to the nearly 50 states that simple random sampling would likely require. |
convenience
simply ask who is around (people sitting next to
you on the bus, in the laundromat as you do your clothes, etc.)
as easy as it comes.
e.g., if Democrats were 60% of the population and Republicans were 40%, then ask, say, 120 Democrats and 80 Republicans.
danger: potential of biased selection within these quotas. (that is, biases based on other factors than party)
No need to make proportional. just have at least 1 entry per cell.
EXAMPLE:
| Cities with Low Public Transit Use | Cities with high public transit use | |
| Growing Cities | Phoenix | San Francisco |
| Declining Cities | Memphis | Philadelphia |
allows for all pertinent combinations to be represented
in a small sample, and hence allow for more in depth study of each. (such
as in case studies -- to be covered later in the semester)
one type: reputational
sampling. select cases based on their reputation.
EXAMPLE: a study interested
in educational reform. First select states, then districts within
state, and then select schools that have the reputation of being innovative.
ask someone in the group, who then refers you to others in the group, etc.
good for deviant subcultures. e.g., interviewing
Hells Angels members, etc.
| 3.
Measures and Indicators |
Conceptualization: linking concepts to measures.
Conceptual summaries are based on real observations. (And yet observation is shaped by our mental preconceptions, so there is a two-way interaction between concepts and measures.)
face validity: how well does the measure match the concept?
Danger: reification. "the process of regarding as real things that are not" [Babbie, 1994: 120]
Can everything be measured? a philosophical question. Babbie (110)
argues that "... we can measure anything that exists.
There are no exceptions. If it exists, we can measure it." But others
would say not. There is often a difference between the ability to name
something, to measure it, to understand it, and to affect it. We
sometimes falsely assume that just because we can name something and measure
it, we therefore understand it. (For example, it is far easier to measure
crime, poverty, urban decline and urban despair than to understand it.)
| EXAMPLE: can everything be measured?
Can we put a price on nature? (e.g., of a free flowing river)
|
Why are measures important?
Why the gap between the data results and
what you want to know?
Some strategies to select and develop measures:
| Variable | Concept | Comments |
| "Percent of Housing Units built 1939 or before" (from US Census) | Age of housing (or more generally, age of city) | Multiple dimensions: There is no simple measure of age of a city, unless one specifies the founding date. |
| "Race" Self-identified based on several categories | Race | Controversial + multiple dimensions. and as of 2000: can select more than one category. |
| Ancestry Self-identified based on several categories | Ancestry | Controversial + multiple dimensions. |
| Density, etc. | Urban Form | A complex concept with many qualitatively different dimensions |
| Highest education achieved | Educational Level | Multiple dimensions: Does one simply look at grade level achieved (quantity or INPUT), or a more substantive measure of quality (OUTCOME)? |
Other examples of complex concepts:
| Concept | Unit of Analysis |
| Globalization | Cities |
| sustainability | Cities |
| High tech | Industry |
| Level of Economic development | City |
| Economic class | Person |
| Urban social alienation | person |
| Citizen participation | person |
| Productivity | person |
interchangeability of indicators
sometimes you may want to, e.g., one is easier to collect than another.
They should have high correlations. Ideally perfect.
But a danger: sometimes we think certain indicators are interchangeable, but
in fact they are different dimensions of a more complex, accurate indicator.
(e.g., GPA and GRE scores for intelligence).
| 4.
Constructing Questionnaires |
[REFER to hypothetical
schedule to show placement of questionnaire draft, testing, revision, coding,
etc.]
1. fear that survey is just marketing
2. fear that information to be used against respondent (e.g., IRS)
3. is tired of surveys
4. hates being a guinea pig
5. "sophisticated respondent" who knows what the survey wants to hear.
6. gives answers that sound proper, rather than truthful.
7. fear of sounding uneducated.
8. my time is too valuable.
9. I've never thought about that.
10. too many questions or redundant questions.
11. not the right questions
asked.
Relevance: 2 parts
1. you are asking the right people (sample)
2. you are asking the right
questions (that match your concepts)
1. a good cover letter
2. put threatening questions at the end, or drop all together.
3, Assure anonymity.
4. make the survey seem relevant
5. have the survey be interesting and at the level of intelligence of the respondents.
6. Avoid wasted or repetitious questions (this is the task of the "Analysis Review of Questionnaire" and the pretest): i.e., don't ask a question without knowing what you will do with it. (and don't be tempted to piggyback questions that really belong on another survey).
7. If you are dealing with a heterogeneous group, a few techniques:
a. use a few different questionnaires.
b. multiple wording (e.g., wife, husband, girlfriend, etc.)
c. skips or contingency questions (if yes, then on to Q 7, etc.)
8. Avoid double-barreled questions (remember, each answer must be quantified, generally along one dimension): or as simple as a yes or no.
9. Avoid ambiguous questions: i.e., if the terminology is unknown.
10. keep wording simple and sentences short.
11. Factual questions are easier than abstract questions: e.g., are you happy?
12. Avoid leading questions: (i.e., leading the respondent to one answer or another): Do you condemn the violent activities of Saddam Hussein?
13. Avoid sensitive or threatening
questions. Sex, suicide, etc. Structure the question so that a socially-undesirable
answer does not stand out. Make it easy for a truthful answer.
Open-Ended
vs. Closed Ended Questions:
| Closed ended positive:
1. standard answers; can be compared 2. easier to code 3. clearer questions lead to clearer answers. 4. avoids irrelevant information. 5. some sensitive questions have a better response with predetermined categories (e.g., income) 6. easier (technically) to answer: check
a box rather than filling in a line. |
Open-ended positive:
1. when you don't know all the categories. 2. can give more detail 3. when there are too many categories (e.g., place of birth) 4. work better for complex issues. 5. more room for creativity and self-expression. (i.e. put a few in an otherwise closed questionnaire to please the respondent, and to give them a chance to provide info. not expressed in closed ended answers). |
| Closed ended negative:
1. too easy to answer when one is guessing or just filling in boxes. 2. categories are limiting, don't fit. 3. categories too many or confusing (esp. a problem on the prone) 4. info falls between the cracks (the categories) 5. variations fall between the cracks (and appear to be identical answers) 6. clerical errors (wrong answer checked/circled) |
Open ended negative:
1. leads to worthless info. 2. non-standardized info. 3. hard to code 4. requires more writing and thinking ability 5. too general answers? 6. take more time 7. require more paper |
| so.........
Use closed ended when: 1. discrete categories (exhaustive, mutually exclusive as well) 2. few categories 3. avoid interval variables that don't break into categories. 4. better for mailed and self-administered surveys.
|
Use open-ended when:
1. complex questions 2. better for interval scale variables 3. good for early exploration You can easily mix both; and this is commonly done.
|
1. sensitive questions come late
2. open-ended questions late
3. easy stuff first (e.g., fact over opinion)
4. ask information needed for subsequent questions first (think of the survey as a memory refreshing process)
5. put questions in logical order (e.g., chronological)
put related questions together; don't jump around.
6. avoid establishing a "response set" i.e., repetition leads to a tendency to answer the questions in a particular way.
7. separate reliability-check question-pairs.
8. be careful about adjacent questions with scaling differences. (one approach: scatter them)
9. vary questions by length and type.
10. how about the funnel technique? from general to specific.
(but Bailey recommends to
stick with the easy stuff first)
Contingency Questions: Very Important
questions only answered by a subset of the sample, as determined by earlier screening or filter questions.
Why used? relevancy; don't want to have respondents put too many NAs.
(alternative: two questionnaires; but that is hard)
KEY: keep the format simple; arrows can confuse.
Of course, this will vary
tremendously depending on whether it is an interview or mail survey. You can
be much more complex with interviews, since the trained interviewer is doing
the decisions about which contingency questions should be asked.
Cover Letter or Introductory Statement:
gives legitimacy.
explains why study is important.
explains why each respondent is important
says who is doing it, what will be done with the info, if there is confidentiality,
Also: how long it will take to complete.
what to do with the questionnaire
(if it is mailed)
Instructions for Interviewers or Respondents:
in mailed questionnaires, keep instructions simple, and perhaps repeat them for each question. (e.g., circle one)
Face sheet for interviewer:
can include specifics on interview: time, length, special problems,
plus race, gender, and other
characteristics (intentionally) not asked.
how to work out the flaws.
it is amazing how many problems jump out during the pretest; problems you could never see by yourself.
You can always do two pretests, just to be sure.
KEY: you want to know, before you do the survey, exactly how you will interpret answers. The pretest will largely eliminate the most glaring ambiguities and other problems that prevent this clear interpretation.
Whom do you pretest? anyone. other students, office workers, etc.
or: you could pick a clustered sample of your target population and do them.
This is also a good time
to do a test run of your coding and see how you will analyze the data. What
is relevant data? what is not? How will you input it? What have you left out?
Options: what to do after the pretest........
1. adding/subtracting questions.
2. change wording
3. changing categories (number, boundaries); even adding categories, if they are not exhaustive
4. changing open-ended to closed ended, and vice versa
5. changing the format
6. adding filter questions and contingency questions
7. change the ordering
8. add more space for open-ended questions
9. get rid of redundancies
10. look for patterns of answers: response sets. (e.g. agree/disagree, etc.)
11. change questions with little or no variation: e.g. 98% one answer.
12. Think about how hard some of the open-ended questions will be to code (e.g. occupation; industry; favorite activity, etc.) How will you cluster or collapse?
13. how long did it take to answer? Have the pretester respondents note this.
14. Finally: "feel of the
questionnaire": paper, look, cover letter, etc. aesthetics. (most important
for mailed questionnaires: does it look like junk mail?)