Assignment
5: Demography |
ANSWER SHEET |
Cohort-Survival Analysis
600 people live in the mysterious country of Pangaea. The country is not found on any map, nor is it visited by ships or aircraft; as a result, there has been no migration to or from the country. Use cohort-survival analysis to answer the following two questions.
1. SCENARIO ONE: Project the total population, and the number of people in each
10-year cohort, for the years 2010 and 2040 [the blue-shaded cells in the table below]. Show your work. [closed population scenario - population changes due only to natural increase/decrease ![]() download this table in Excel format
download this table in Excel format
| ANSWER |
Cohort Survival Analysis -- to forecast population in the future
Note: the method below comes up with a HIGH ESTIMATE -- all those who enter a cohort are at risk of having a child.
| Age Group (years) | Population
in Year 2000 |
Survival
Rate |
Birth
Rate |
Population
in Year 2010 |
2020 | 2030 | Population
in Year 2040 |
| 0 - 9 | 100 |
0.95 |
0 |
131 | 134 | 140 | 160 |
| 10 - 19 | 100 |
0.99 |
0.3 |
95 | 124 | 127 | 133 |
| 20 - 29 | 100 |
0.95 |
0.7 |
99 | 94 | 123 | 126 |
| 30 - 39 | 80 |
0.92 |
0.3 |
95 | 94 | 89 | 117 |
| 40 - 49 | 70 |
0.9 |
0.1 |
74 | 87 | 87 | 82 |
| 50 - 59 | 50 |
0.8 |
0 |
63 | 66 | 79 | 78 |
| 60 - 69 | 40 |
0.7 |
0 |
40 | 50 | 53 | 63 |
| 70 - 79 | 30 |
0.5 |
0 |
28 | 28 | 35 | 37 |
| 80 - 89 | 20 |
0.3 |
0 |
15 | 14 | 14 | 18 |
| 90 and above | 10 |
0.1 |
0 |
7 | 5 | 5 | 5 |
| TOTAL | 600 |
646.6 | 697.5 | 751.8 | 818.1 | ||
| rounded | 647 | 697 | 752 | 818 |
Notes:
survival rate -- proportion of people in cohort who survive into next cohort.
birth rate -- the number of children born per person in cohort during the time
interval (ten years)
Population for a given year is counted on January 1 (e.g., on January 1, 2000 the population was 600 people).
Comments:
Alternative Estimates:
One important question (regarding how one calculates the numbers of births) is determining who is "at risk" of leading to a birth. Here there are three alternatives: (a) assume that anyone who enters a cohort (regardless of whether they die during that cohort period) is "at risk" (this is the assumption used in the in-class handwritten example, which will lead to a slight overestimate of children born); (b) assume that only those who survive the entire cohort period is "at risk" (which will lead to a slight underestimate of children born); or (c) use an average of the two (which would lead to a middle estimate). For this assignment, any of the three approaches is fine. Please do note what assumptions you make.
Low estimate: If you made the assumption that only those who survive through the entire 10 year cohort period are "at risk" of having a baby, then the estimate would be lower: 640 people in the year 2010, and 784 people in the year 2040.
Middle estimate: If you compromised and assumed that those people alive at the middle of the cohort are at risk of having a baby -- assuming linear rates of mortality within the cohort -- then the resulting values are 643 people in the year 2010, and 801 people in the year 2040.)
2. SCENARIO TWO (open population with migration): Pangaea is worried about insufficient population growth, and decides to use in-migration (rather than encouraging increased fertility) to stimulate faster population growth. The country decides to invite 50 outsiders to move to the island on January 2, 2000. To maximize the country's population in time for the nation's Centennial in the year 2040, what age group(s) should the 50 immigrants belong to in 2000? What would the total population and population by age group be in 2040? [the blue-shaded cells in the table below]
| ANSWER |
50 migrants in the age 10-19 cohort would maximize the population in the year 2040. New migrants potentially contribute to population increases in two ways: (a) they increase the population themselves (and this has a longer impact if they have a longer life expectancy from the age of migration), and (b) they give birth to new residents. Migrants aged 10-19 cohort do both, and they experience all their reproductive years in Pangaea, while still having a long life expectancy (so that most will still be around in the year 2040). (Note: migrants in the age 20-29 cohort would lead to the second-highest population increase. Migrants in the 0-9 age category would contribute the most person-years to the island population, but since they would not begin reproducing for another 10 years, their impact on the next generation is less rapid. Migrants in the 50+ year age categories would have no long-term impact on population levels.)
Two important notes:
1. the assignment specified that the 50 migrants arrive on January 2, 2000 (therefore at the BEGINNING of the first ten-year time period). As a result, they are "at risk" of giving birth to new Pangaeans during the entire 2000 - 2010 decade. (If you mistakenly added them at the end of the decade rather than at the beginning, your population estimates will be too low.)
2. It is important to explain and demonstrate HOW you determined that the 10-19 cohort is the right answer: (a) trial and error? (b) a good guess? (c) logical deduction? In this case, you can logically eliminate from the outset all cohorts past the reproductive years (i.e.,50+ years old) [strategy (c)], but you likely need to actually run the numbers on the other scenarios to see which has the highest population outcome [strategy (a)].
| Age Group (years) | Population in Year 2000 (Jan 1) |
Survival Rate |
Birth rate |
Net Migrants on Jan 2, 2000 |
Adjusted Pop on Jan 2, 2000(after migration) | 2010 |
2020 |
2030 |
2040 |
| 0 - 9 | 100 |
0.95 |
0 |
100 |
146 |
168 |
159 |
184 |
|
| 10 - 19 | 100 |
0.99 |
0.3 |
+50 |
150 |
95 | 139 | 160 | 151 |
| 20 - 29 | 100 |
0.95 |
0.7 |
100 |
149 | 94 | 137 | 158 | |
| 30 - 39 | 80 |
0.92 |
0.3 |
80 |
95 | 141 | 89 | 130 | |
| 40 - 49 | 70 |
0.9 |
0.1 |
70 |
74 | 87 | 130 | 82 | |
| 50 - 59 | 50 |
0.8 |
0 |
50 |
63 | 66 | 79 | 117 | |
| 60 - 69 | 40 |
0.7 |
0 |
40 |
40 | 50 | 53 | 63 | |
| 70 - 79 | 30 |
0.5 |
0 |
30 |
28 | 28 | 35 | 37 | |
| 80 - 89 | 20 |
0.3 |
0 |
20 |
15 | 14 | 14 | 18 | |
| 90 and above | 10 |
0.1 |
0 |
10 |
7 | 5 | 5 | 5 | |
| TOTAL | 600 |
+50 |
650 |
711.1 | 793.4 | 860.5 | 944.5 | ||
| rounded | +50 |
650 |
711 | 793 | 861 | 945 |
Comparison of future population levels based on different migrant age group scenarios:
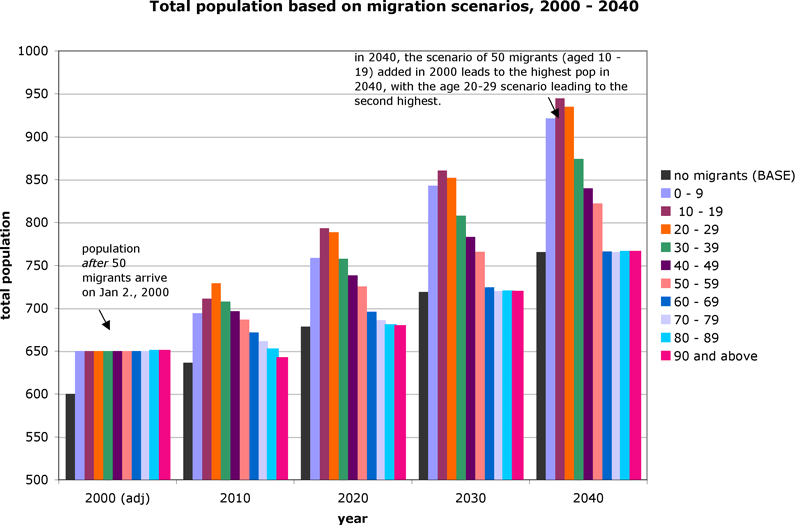
Note that migrants in the older age groups have little or no impact on long-term population levels: few survive to the year 2040, and they migrate to Pangaea after they have aged-out of their reproductive years.
3. Optional Extra credit: estimate the life expectancy (e0) of a Pangaean baby born in the year 2000. (Briefly explain and document your method.)
| ANSWER |
The life expectancy (e0) is 63.6 years, which is e0 = T0 / l0 = 6127.4 / 100 = 61.3.
| Age Group (years) | Survival Rate [GIVEN] |
qx (proportion dying = 1-survival rate) |
lx (number living at beginning of age interval) |
Lx (Stationary population in the age interval) |
Tx (stationary population in this and all subsequent age intervals -- that is, cumulative Lx) |
ex (life expectancy at beginning of age interval, in years) |
| 0 - 9 | 0.95 |
0.05 | 100.0 | 975.0 | 6127.4 | 61.3 |
| 10 - 19 | 0.99 |
0.01 | 95.0 | 945.3 | 5152.4 | 54.2 |
| 20 - 29 | 0.95 |
0.05 | 94.1 | 917.0 | 4207.1 | 44.7 |
| 30 - 39 | 0.92 |
0.08 | 89.3 | 857.7 | 3290.2 | 36.8 |
| 40 - 49 | 0.9 |
0.1 | 82.2 | 780.9 | 2432.4 | 29.6 |
| 50 - 59 | 0.8 |
0.2 | 74.0 | 665.8 | 1651.5 | 22.3 |
| 60 - 69 | 0.7 |
0.3 | 59.2 | 503.1 | 985.7 | 16.7 |
| 70 - 79 | 0.5 |
0.5 | 41.4 | 310.7 | 482.6 | 11.7 |
| 80 - 89 | 0.3 |
0.7 | 20.7 | 137.8 | 171.9 | 8.3 |
| 90 and above | 0.1 |
0.9 | 6.8 | 34.2 | 34.2 | 5.0 |
Further comments / advice:
Cohort -Survival Method