Apr 2. 2013Figure below show the accuracy of Active Learning algorithm that selects queries based on margin.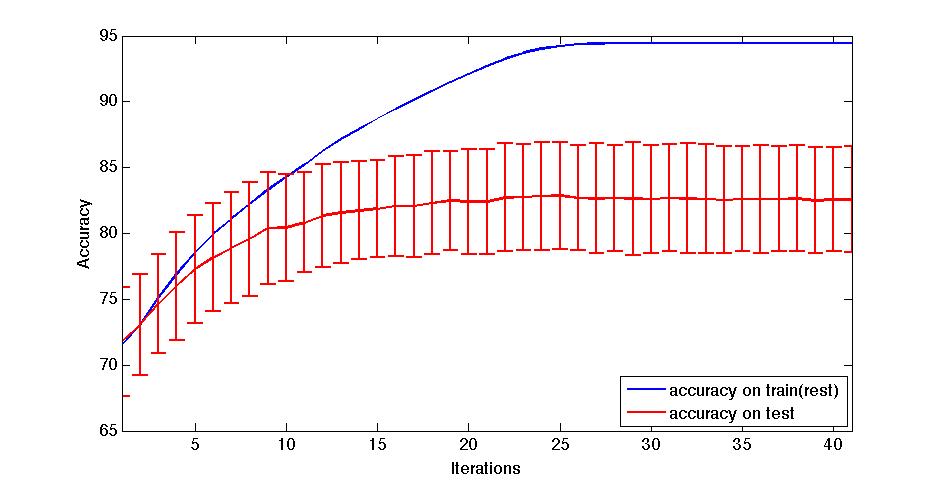 Mar 18. 2013Figure below shows how far we are and how good we can get.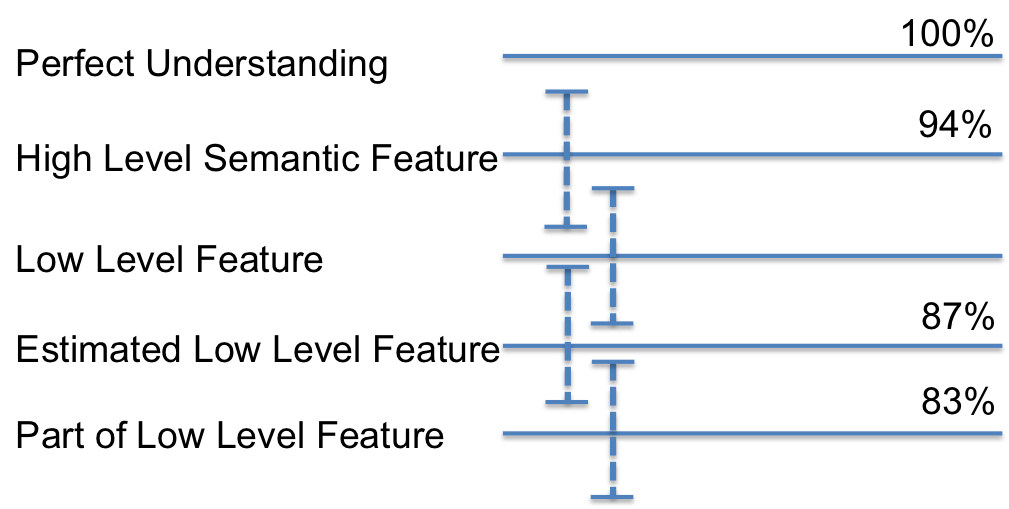 Figure below shows the performance of different selection of hashtags. 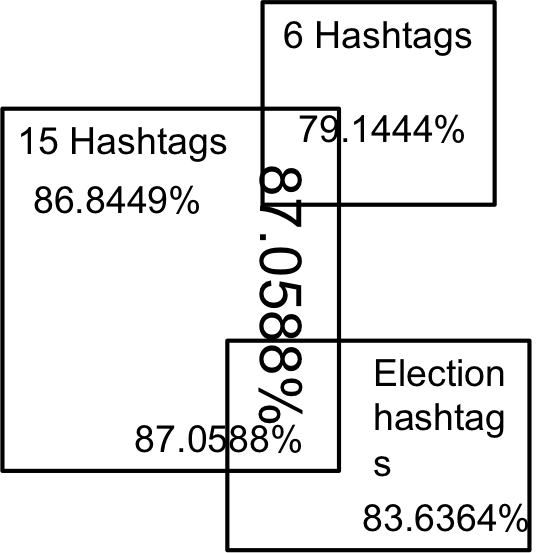 Figure below shows that we train 500 classifiers for 500 popular hashtags generated from random samples and use these classifiers to predict Political Tweets.. 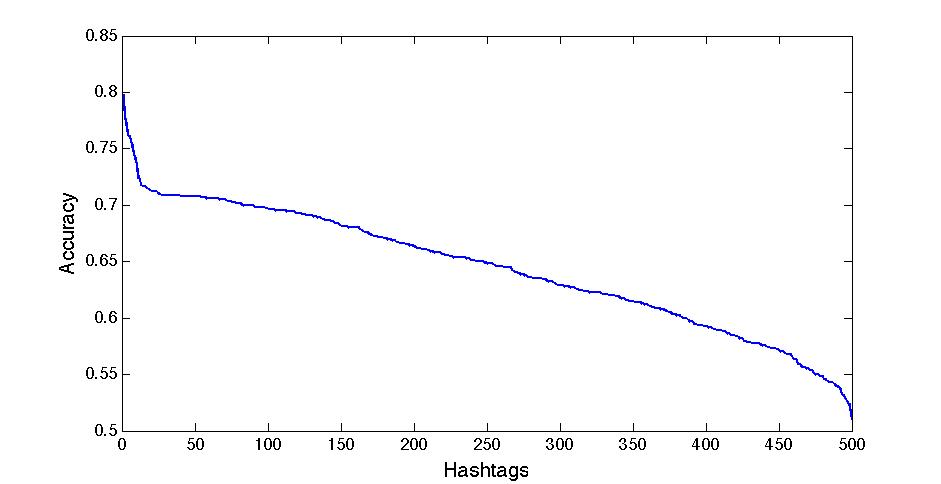 Figure belwo shows the top 10 effective hashtags 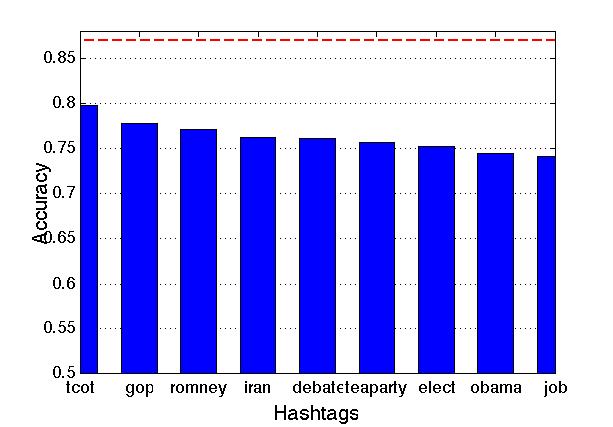 Mar 4. 2013Figure below shows weighted SVM give rate of labled dataset 10, 20 ,..., 100 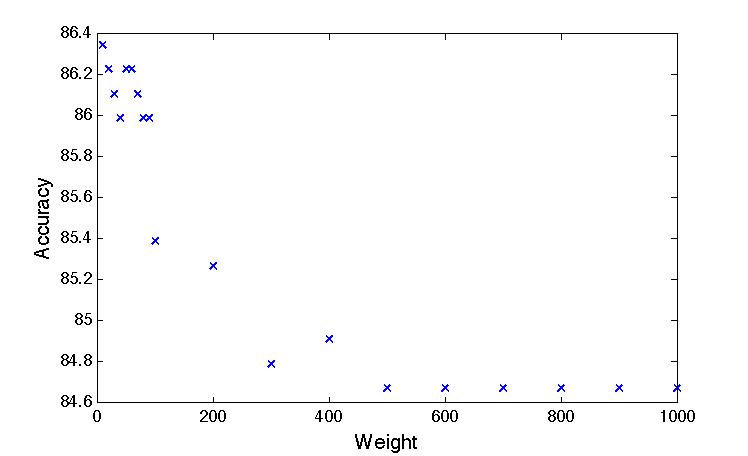 Figure below shows finer scale number of features reserved in feature selection algorithm. 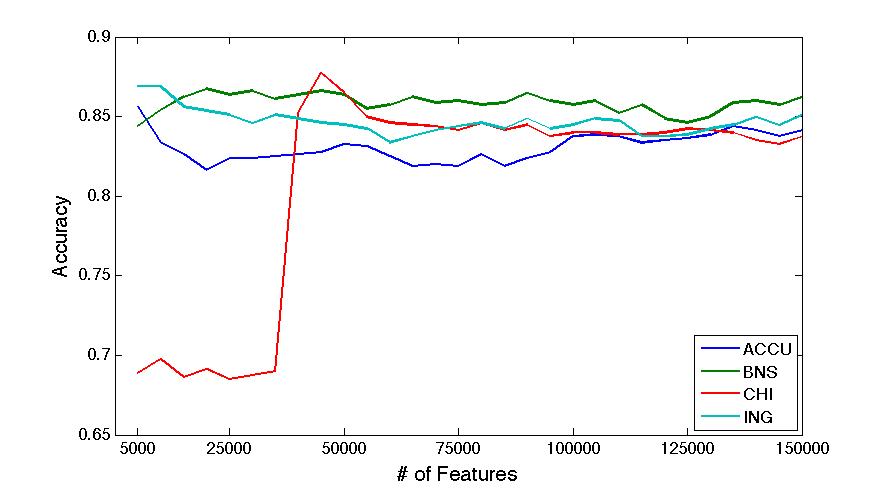 Feb 25. 2013Human Classifier as Upper BoundTreating the six human annotators' labeling results as six classifier. We use the other five coders' majoraty votes as test set. Get the following Accuracy: 0.9390, 0.9000, 0.9415, 0.9024, 0.9756, 0.9756. The mean accuracy is 0.9390. This can provide us intuition of the upper bound of how well computer algorithm can do. Increasing Training Data Size using Hash Tag and Classifier DignosisFigure below shows the Error rate assosiating with Training Set Size. We can see that 1:2 positive:negative data set has a better performance.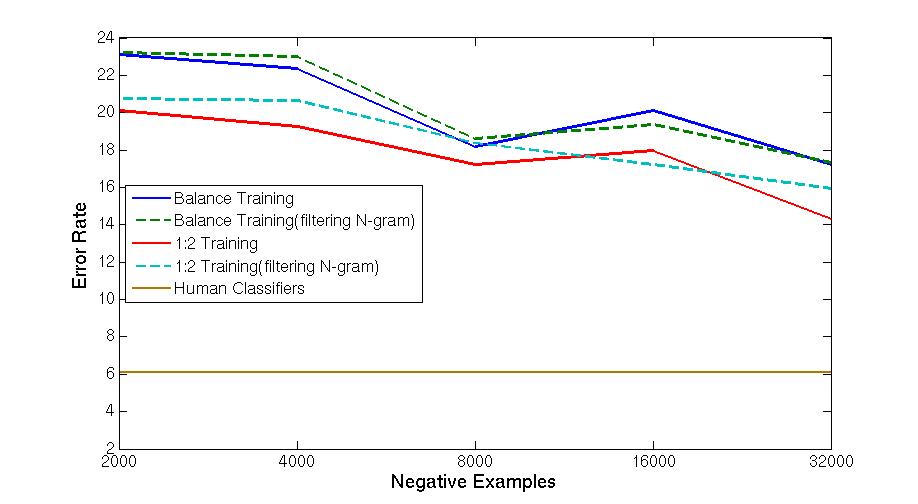 Figure below is the performance analysis of classifier trained by HashTag, the classifier has high variance as well as high bias(at 96000). 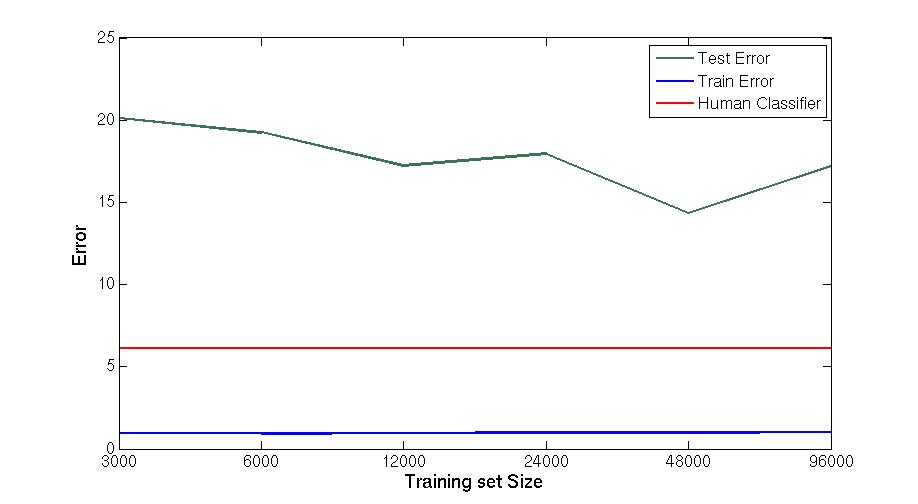 Figure below is the performance analysis of classifier trained by Labled dataset, we can see that it suffers from high variance and more data examples are needed. 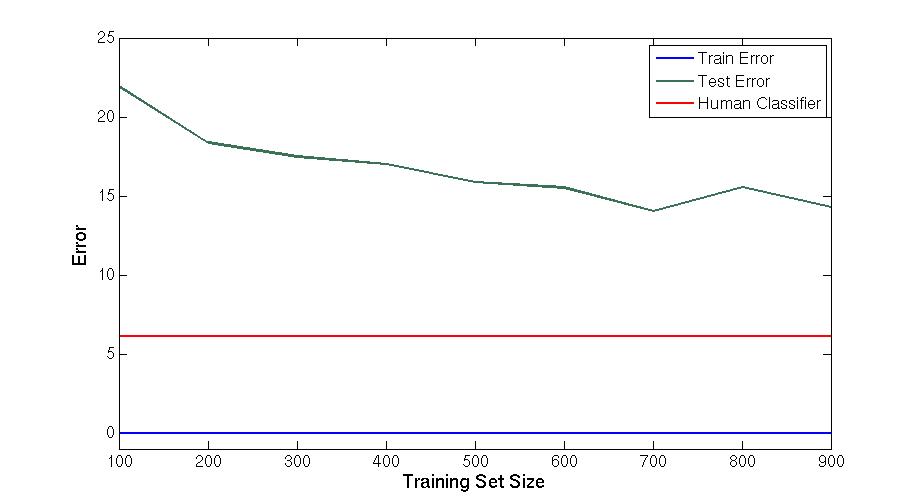 Figure below is feature selection from d-500 to d-32000. We use only estimated dataset to train and 800 labeled tweets as test. 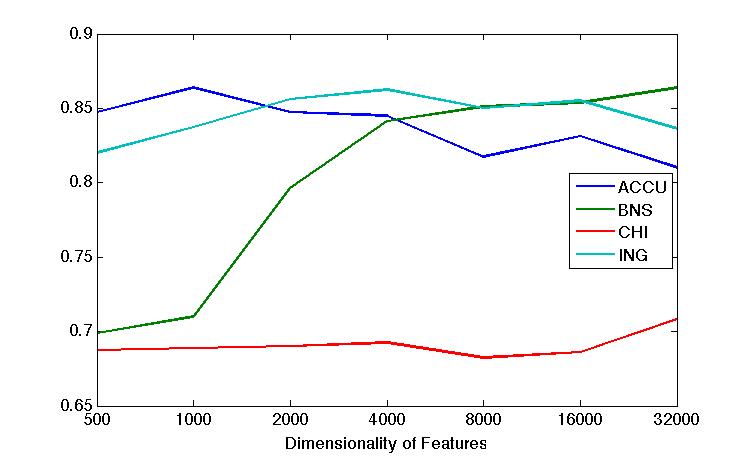 Learning with Limited Labeled Examples and Sufficient Estimanted ExamplesDo a literature Search on this.Possible Idea: Multiple Instance LearningAdd a labeled data point in each bag, or define bag with scores.Tuning ClassifierPreprocessing: Change to lower cases, Using Krovetz word stemming from Lemur. Feature Extration: Unigram and Unigram to Trigram. Classifer Used: Linear Kernel SVM. Feature Selection Methods: Accu, BNS, CHI, Information Gain. Results are shown in following Figures. Results: There are 2833 uni-grams and 18368 n-grams. The x-axises of the figrues are number of feature selected using different feature selection methods. The y-axises are the average accuracy on 10-fold cross validation. Using only uni-gram, Raw Feature: AP = 0.8315, Feature Selection: BNS AP = 0.8389. Using uni-gram, bi-gram and tri-gram, Raw Feature: AP = 0.7963, Feature Selection: ACCU AP = 0.8222. 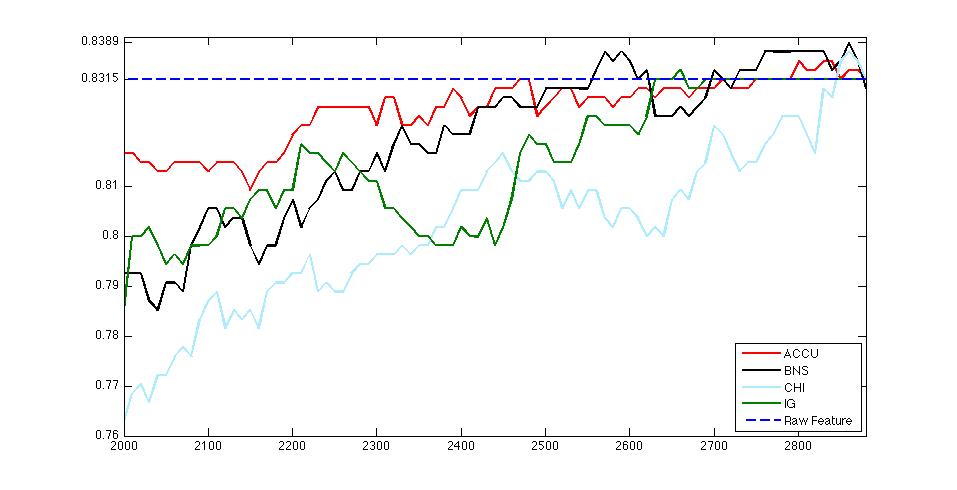
Average Accuarcy on 10-fold cross validation using Uni-gram 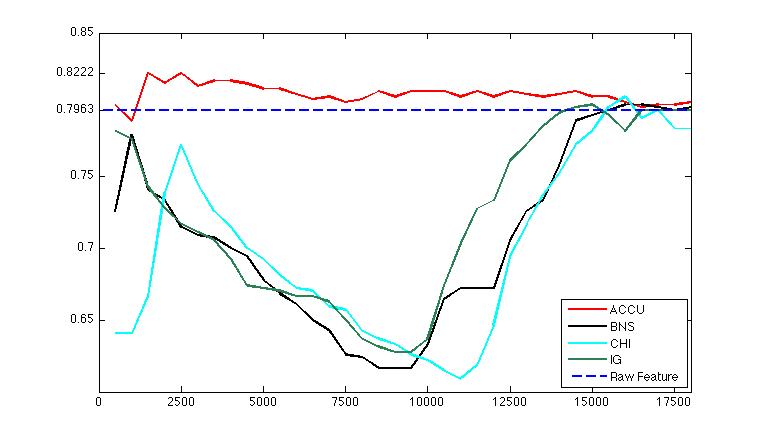
Average Accuracy on 10-fold cross validation using n(1-3)-gram 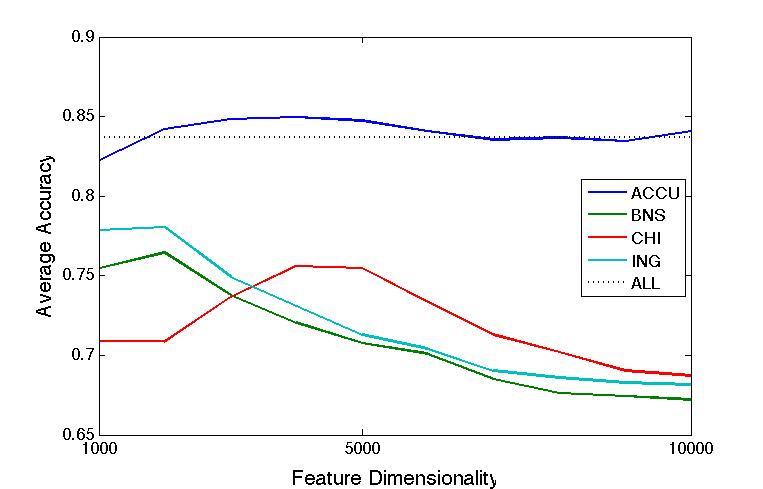
Average Accuarcy on 10-fold cross validation using 935 data set. CodebookLabeling DataI am glad that you could offer help on labeling tweets for us. Before labeling, please carefully read the definition of Information Need on Twitter and the examples listed in detail. To Labeling Page(Under Construction).Our Dataset |
|||