Interwoven
Structure & Size Selection
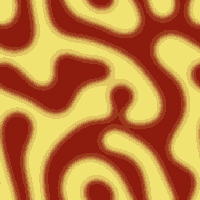
We have discussed before
about the refining effect of surface stress. The following figure compares two evolution sequences
with/without surface stress. The
sequences are for evolution from t = 0 to t = 1.0E6. The time unit in the figures is t. The size of each figure is 256b´256b. In the simulation,  and Q are taken to be 2.2 and 1, respectively. The sequence on the left (a) has isotropic surface stress
while the sequence on the right (b) has no effect of surface stress. The average concentration is taken to
be 0.5. The initial condition is
set to fluctuate randomly within 0.001 from the average. The initial condition is the same for
the two sequences.
and Q are taken to be 2.2 and 1, respectively. The sequence on the left (a) has isotropic surface stress
while the sequence on the right (b) has no effect of surface stress. The average concentration is taken to
be 0.5. The initial condition is
set to fluctuate randomly within 0.001 from the average. The initial condition is the same for
the two sequences.
It is
observed that in sequence (a), the phases form interwoven structures with width
of the stripes in nanoscale. The
width of the stripes is almost invariant when it reaches certain size after
short time of evolution. This
size is determined by the competition of coarsening and refining, reflecting
the intrinsic length scale of the system. In sequence (b), we can also observe similar interwoven
structures during the evolution. However, these structures do not have any stable size – they always
coarsen. The only restriction is
the calculation cell size, periodic boundary condition, and mass
conservation. We can imagine the
system will coarsen into a state that minimizes the area of phase boundary
within the restriction. Such a
state would be a configuration that one phase takes half of the cell and the
other phase takes the rest. This
is confirmed by the figure of sequence (b) at t=1.0E6. The comparison of sequence (a) with
(b) clearly demonstrates the refining effect of surface stress.
Non-uniform
concentration in the epilayer generates a strain in the substrate, which
decays exponentially along the  direction. The
following figure shows the strain concentration in the substrate.
direction. The
following figure shows the strain concentration in the substrate.