Chronis Lab
Neuronal Aging
Research
Neuronal Aging of C. elegans
Aging, a degenerative process when viewed from the biological prospective, is often associated with a high probability of an age-related disease or disability, low physical and mental function capacity and low engagement with life. Revealing how the overall neuronal functionality and how specific neuronal properties alter with age is considered to be a major step towards understanding the molecular mechanisms of age-related diseases and disorders.
The multivariate, environment-dependant character of aging, led to the adoption of animal models that can be easily genetically manipulated, have a short lifespan and can develop and age in a controllable lab environment. Over the last three decades, C. elegans, a tiny nematode with powerful genetics and a well-defined nervous system, has become a prominent model organism for studying the process of aging.
We propose to combine calcium imaging with microfluidics to quantify the effect of aging to the functionality of major sensory neurons of C. elegans in vivo. We hypothesize that the biophysical properties of the sensory neurons in C.elegans are altered with age. We also hypothesize that oxidative stress is one factor that results in the degradation in the neuronal performance and that anti-oxidative stress substances can minimize oxidative damage. By using calcium indicators, we will be able to probe the biophysical properties (neuronal sensitivity, time response and amplitude of depolarization) of these neurons when triggered with a certain stimulus. The microfluidics will provide the automation that is required for obtaining repeatable and accurate imaging data from a large number of worms. In order to validate our hypotheses, imaging data from various populations of worms (wild-type, mutants and antioxidants-treated worms) of different ages will be compared and statistically significant trends will be obtained.
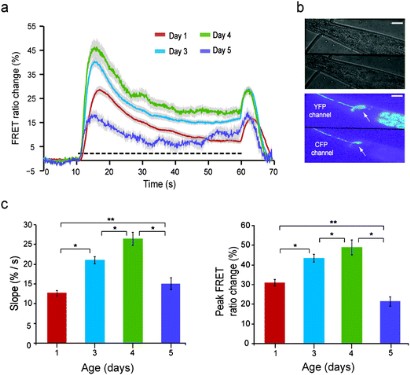
ASH ratiometric transients in response to a hyperosmotic stimulus (1 M glycerol) for different ages (L4 worms are taken as Day 0 worms). (a) The individual curves represent an average of 80, 60, 60 and 12 recordings from Day 1, Day 3, Day 4 and Day 5 worms respectively. The dashed line represents the presence of the stimulus. (b) Bright-field (top) and pseudo color fluorescence (bottom) image of a trapped worm. The neuron is marked with the arrow. In the pseudo color image, the top and bottom half represent the YFP and CFP channels respectively. Scale bars, 5 µm. (c) The slope (left) and peak (right) of the on-response (extracted from a). Error bars indicate standard error of mean. **P < 0.001 and *P < 0.01 (Student's t-test).
An automated microfluidic platform for calcium imaging of chemosensory neurons in Caenorhabditis elegans
Trushal Vijaykumar Chokshi, Daphne Bazopoulou and Nikos Chronis
Lab Chip, 2010, 10, 2758-2763