- Direct measurement (see in-class demonstration)
- Tabulated data in Tables 1 and 2)
Table 1: Average Energy Consumption (liters O2/min)1 for females by body weight2.
|
|
Females 18-24 |
Females 55-64 |
|
ml/Kg |
5% |
Avg |
95% |
5% |
Avg |
95% |
|
/min |
45Kg |
58Kg |
82Kg |
47Kg |
65Kg |
92Kg |
|
|
45.4 |
58.2 |
82.3 |
47.3 |
65.4 |
92.3 |
| Sleep |
3.20 |
0.15 |
0.19 |
0.26 |
0.15 |
0.21 |
0.30 |
| Sitting |
4.00 |
0.18 |
0.23 |
0.33 |
0.19 |
0.26 |
0.37 |
| Standing |
4.80 |
0.22 |
0.28 |
0.39 |
0.23 |
0.31 |
0.44 |
| Walk@2.0mph |
9.00 |
0.41 |
0.52 |
0.74 |
0.43 |
0.59 |
0.83 |
| Walk@3.0mph |
12.50 |
0.57 |
0.73 |
1.03 |
0.59 |
0.82 |
1.15 |
| Walk @4.0 |
16.00 |
0.73 |
0.93 |
1.32 |
0.76 |
1.05 |
1.48 |
| Walk@4.5mph |
20.00 |
0.91 |
1.16 |
1.65 |
0.95 |
1.31 |
1.85 |
| Run@5.omph |
24.00 |
1.09 |
1.40 |
1.97 |
1.13 |
1.57 |
2.21 |
| Run@5.5mph |
29.00 |
1.32 |
1.69 |
2.39 |
1.37 |
1.90 |
2.68 |
| Bicyle@13.0 |
31.40 |
1.43 |
1.83 |
2.58 |
1.48 |
2.06 |
2.90 |
| Run@7.0mph |
38.00 |
1.73 |
2.21 |
3.13 |
1.80 |
2.49 |
3.51 |
| Run@8.0mph |
48.00 |
2.18 |
2.79 |
3.95 |
2.27 |
3.14 |
4.43 |
| Run@10.0mph |
57.00 |
2.59 |
3.32 |
4.69 |
2.69 |
3.73 |
5.26 |
| Comp Swim |
68.50 |
3.11 |
3.99 |
5.64 |
3.24 |
4.48 |
6.32 |
Table 2: Average Energy Consumption (liters O2/min)1 for males by body weight2.
|
|
Males 18-24 |
Males 55-64 |
|
|
5% |
Avg |
95% |
5% |
Avg |
95% |
|
ml/Kg
/min |
56Kg |
73Kg |
101 Kg |
57 Kg |
77 Kg |
101 Kg |
| Sleep |
3.20 |
0.18 |
0.23 |
0.32 |
0.18 |
0.25 |
0.32 |
| Sitting |
4.00 |
0.23 |
0.29 |
0.40 |
0.23 |
0.31 |
0.40 |
| Standing |
4.80 |
0.27 |
0.35 |
0.48 |
0.27 |
0.37 |
0.48 |
| Walk@2.0mph |
9.00 |
0.51 |
0.66 |
0.91 |
0.51 |
0.70 |
0.91 |
| Walk@3.0mph |
12.50 |
0.70 |
0.91 |
1.26 |
0.71 |
0.97 |
1.26 |
| Walk @4.0 |
16.00 |
0.90 |
1.17 |
1.61 |
0.91 |
1.24 |
1.61 |
| Walk@4.5mph |
20.00 |
1.13 |
1.46 |
2.02 |
1.14 |
1.55 |
2.02 |
| Run@5.omph |
24.00 |
1.35 |
1.76 |
2.42 |
1.36 |
1.85 |
2.42 |
| Run@5.5mph |
29.00 |
1.63 |
2.12 |
2.93 |
1.65 |
2.24 |
2.93 |
| Bicyle@13.0 |
31.40 |
1.77 |
2.30 |
3.17 |
1.78 |
2.43 |
3.17 |
| Run@7.0mph |
38.00 |
2.14 |
2.78 |
3.83 |
2.16 |
2.94 |
3.83 |
| Run@8.0mph |
48.00 |
2.71 |
3.51 |
4.84 |
2.73 |
3.71 |
4.84 |
| Run@10.0mph |
57.00 |
3.21 |
4.17 |
5.75 |
3.24 |
4.40 |
5.75 |
| Comp Swim |
68.50 |
3.86 |
5.01 |
6.91 |
3.89 |
5.29 |
6.91 |
1Exercise Testing and Training of Apparently Healthy Individuals:
A Hand Book for Physicians, The American Heart Association, 1972
2 National Health Survey data
For a more detailed metabolic analysis see the UofM Energy Expenditure Prediction ProgramTM (EEPP) software
Problem 1: Predict the energy demand for 21 and 57.5 year old males and females
of average weight and condition walking at 3mph and 5mph?
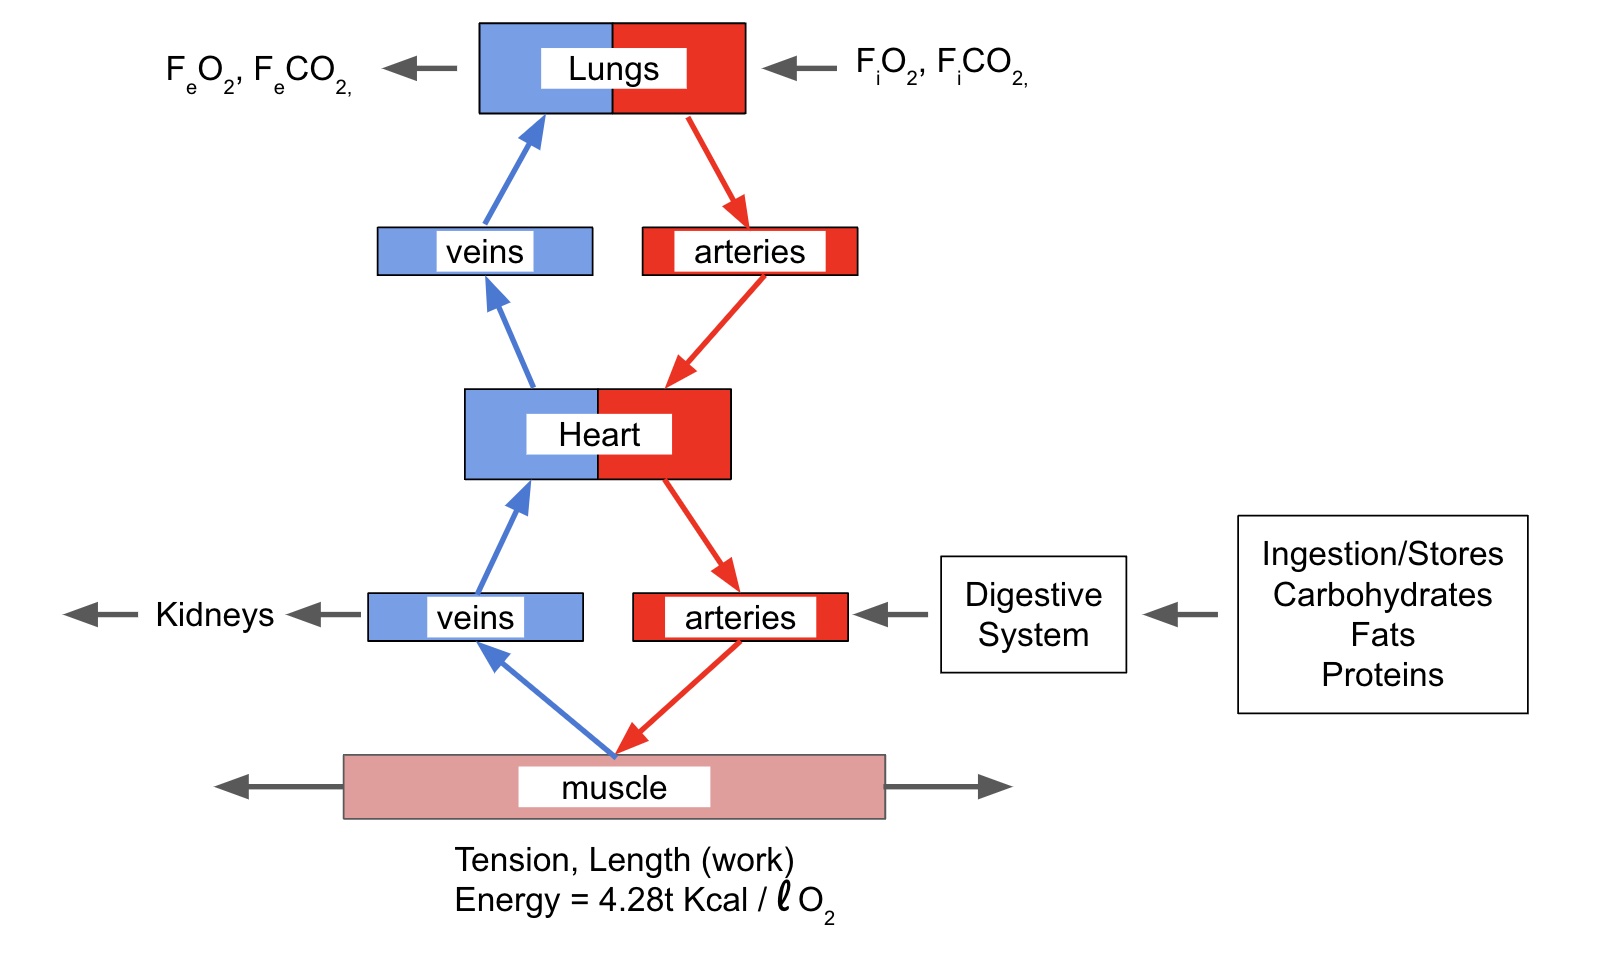
- 21 Year old: E = VO2 (ml/Kg/min) x Body mass (Kg) x 1.0
l/1,000mlx 4.825 Kcal/l O2
Updated fatigue curves (Wu and Wang 2002)
Based on 6 healthy males and females between 25 & 30 years of age.
MAWT=95.33xe-7.28x%VO2max, r2=0.83; SEE=1.09 hour
MAWT=26.12xe-4.81x%RHR, r2=0.87 See= 1.07 hour
MAWT=37.80xe-6.366x%RVO2, r2=0.83 SEE=1.12 hour
Where:
- MAWT = Maximum Acceptable Work Time (hours)
- VO2max = Maximum oxygen uptate rate (aerobic capacity)
- %VO2max = Percent of maximum aerobic Capacity =
(VO2work ± VO2rest)/(VO2max ± VO2rest) x 100%.
- %RHR = Perent of Relative Heart Rate =
(HRwork ± HRrest)/(HRmax ± HRrest) x 100%,
References
Bink, B. 1962, The physical work capacity in relatition to working time and
age. Ergonomics, 5, 25-28.
Bonjer, F. 1962, Actual energy expenditure in relation to the physical work
capacity. Ertonomics, 5, 29-31.
Borg, G. Psycholphysical scaling with applications in physical work and the
perception of exertion, Scand J. Work Environ Health , 16(Suppl 1): 55-58,
1990.
Garet M, Boudet G, Montaurier C, Vermorel M, Coudert J, Chamoux A.
Estimating relative physical workload using heart rate monitoring: a validation
by whole-body indirect calorimetry. European journal of applied physiology.
2005 May 1;94(1-2):46-53.
Gibreth: The Writings of the Gilbreths,W. Spriegel, and C. Myers (eds.),
Homewood, NJ: Richard D. Irwin,Inc
McArdle, W., F. Katch, V. Katch 1996, Exercise Physiology: Energy, Nutrition,
and Human Performance. Fourth Edition, Baltimore, MD: Williams &Wilkin.
Garg, A., Chaffin, D.B. and Herrin, G.D., 1978. Prediction of metabolic rates
for manual materials handling jobs. American Industrial Hygiene Association Journal,
39(8), pp.661-674.
Schmidt, Robert F., and Gerhard Thews, eds. Human Physiology. Springer Science & Business Media, 2013. pp. 647-648.
https://books.google.com/books?hl=en&lr=&id=8WrmCAAAQBAJ&oi=fnd&pg=PA3&dq=robert+schmidt+human+physiology+&ots=9-6Buav6Bw&sig=2sNwx4UjOmCG7Kmnx-zh5YZ-4ts#v=onepage&q=robert%20schmidt%20human%20physiology&f=false
Wu HC, Wang MJ. Relationship between maximum acceptable work time and physical workload.
Ergonomics. 2002 Mar 1;45(4):280-9.