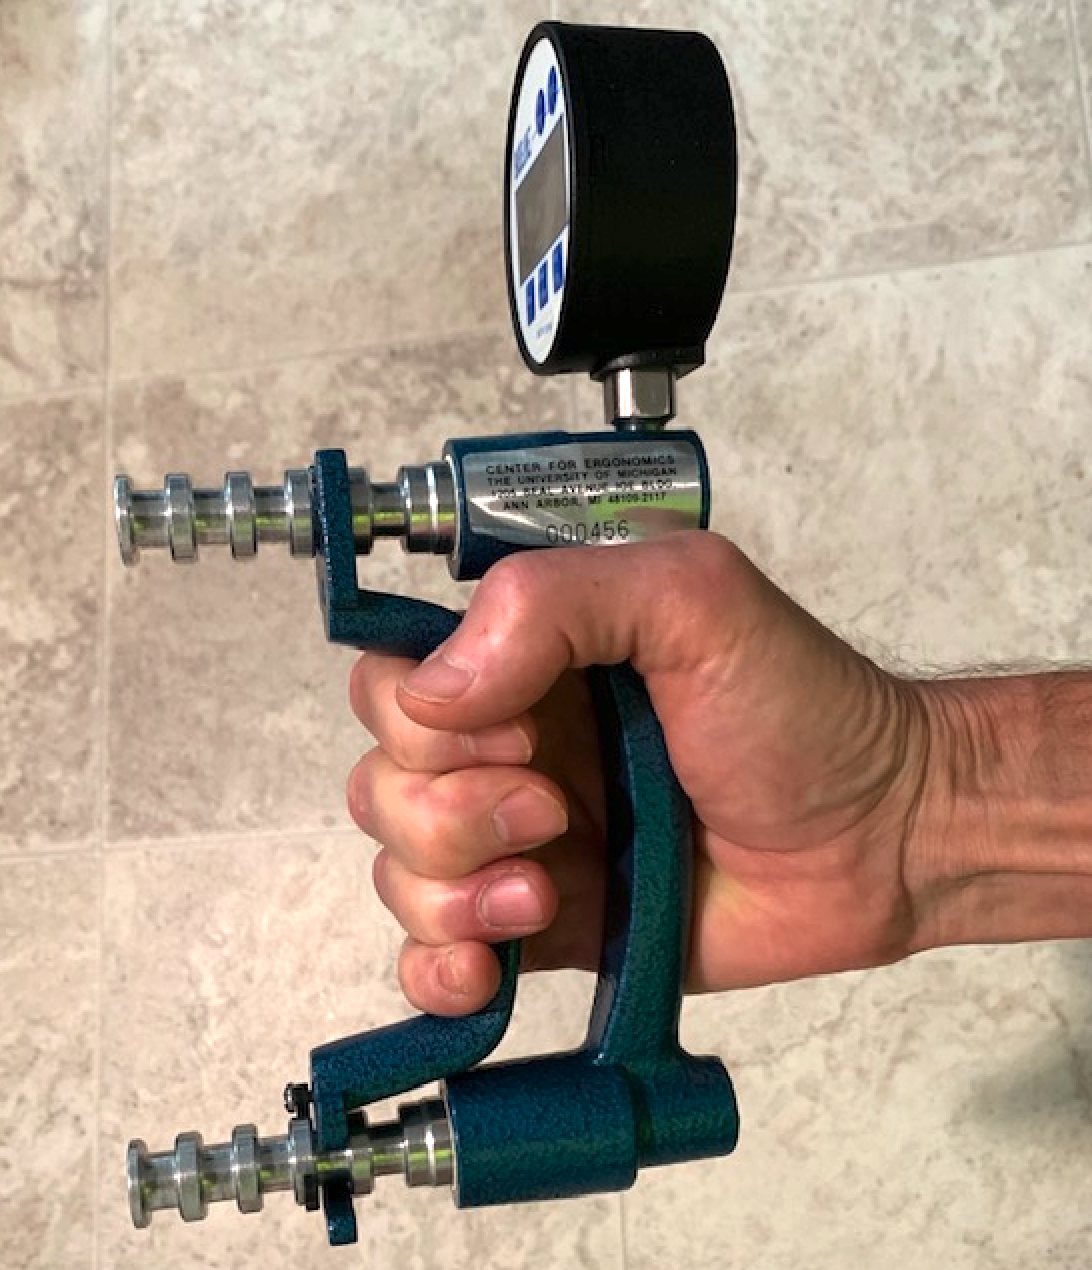
- adjust the grip dynamometer so that the thumb and index finger overlap
- zero the grip dynamometer
- perform a maximal exertion while counting slowly to 5 (5s)
- do not:
- jerk
- press against external objects
- repeat using the thumb and first two fingers with the pinch dynamometer:
- the pinch dynamometer is not adjustable
- record: sex, age and weight

(a s) (b)
- males
- females
- pooled
- Yes, but it is hard to see this from your data because age only ranged from 20 to 32 years. Recall that age actually increase somewhat in this range. Remember it is hard to find a relationship between two ariables if you don't have much variablity in your dependent variable.
- Yes, You can see this in your scatter plot and from your regression
and correlation coefficients. There are two important factors contributing to this relationship.
- First, gender and age are related. On the average females have a smaller body mass than males. The average female mass for this class was 59.6Kg versus 85.5 for the males.
- Second, heavier people must exert more force to support their body weight than lighter people. This contributes to strength conditioning.
- Yes, You can see this in your scatter plot and from your regression and correlation coefficients. Both exertions involve many of the same muscles and similar mechanical parameters.
- a 5% female grip strength
- Discuss possible applications for these data?
Sample Data:
| Sex | Age | Wt-Kg | Grip-Kg | Pinch-Kg |
| 0 | 26 | 70 | 41 | 5.5 |
| 0 | 23 | 42 | 33 | 2.6 |
| 0 | 23 | 61 | 30 | 1.2 |
| 0 | 26 | 73 | 40 | 3.2 |
| 0 | 32 | 64 | 32 | 2.0 |
| 0 | 20 | 52 | 33 | 1.7 |
| 0 | 20 | 59 | 34 | 2.3 |
| 0 | 21 | 50 | 31 | 1.5 |
| 0 | 21 | 64 | 37 | 2.2 |
| 0 | 22 | 61 | 43 | 2.2 |
| 0 | 21 | 59 | 33 | 2.2 |
| 0 | 21 | 59 | 28 | 1.2 |
| 1 | 22 | 118 | 55 | 6.0 |
| 1 | 25 | 82 | 58 | 3.6 |
| 1 | 23 | 91 | 51 | 7.2 |
| 1 | 23 | 80 | 55 | 5.5 |
| 1 | 23 | 80 | 63 | 9.4 |
| 1 | 25 | 91 | 50 | 6.6 |
| 1 | 29 | 81 | 65 | 8.0 |
| 1 | 22 | 77 | 44 | 4.8 |
| 1 | 23 | 80 | 40 | 3.1 |
| 1 | 29 | 77 | 63 | 4.3 |
| 1 | 27 | 77 | 51 | 4.5 |
| 1 | 26 | 77 | 45 | 4.5 |
| 1 | 23 | 86 | 45 | 4.5 |
| 1 | 22 | 84 | 58 | 4.8 |
| 1 | 23 | 109 | 52 | 5.6 |
| 1 | 21 | 61 | 51 | 4.5 |
| 1 | 21 | 91 | 46 | 6.2 |
| 1 | 21 | 95 | 41 | 8.2 |
Female
| Min | 20 | 42 | 28 | 1.2 |
| Max | 32 | 73 | 43 | 5.5 |
| Avg | 23.0 | 59.6 | 34.6 | 2.3 |
| Stdev | 3.5 | 8.4 | 4.7 | 1.2 |
| 5% | 20.0 | 46.5 | 29.1 | 1.2 |
| 95% | 28.7 | 71.5 | 41.9 | 4.2 |
Male
| Min | 21 | 61 | 40 | 3.1 |
| Max | 29 | 118 | 65 | 9.4 |
| Avg | 23.8 | 85.5 | 51.8 | 5.6 |
| Stdev | 2.5 | 12.8 | 7.6 | 1.7 |
| 5% | 21.0 | 74.9 | 40.9 | 3.5 |
| 95% | 29.0 | 110.5 | 63.3 | 8.4 |
Pooled
| Min | 20 | 42 | 28 | 1.2 |
| Max | 32 | 118 | 65 | 9.4 |
| Avg | 23.5 | 75.1 | 44.9 | 4.3 |
| Stdev | 2.9 | 17.0 | 10.8 | 2.2 |
| 5% | 20.5 | 51.0 | 30.5 | 1.3 |
| 95% | 29.0 | 103.0 | 63.0 | 8.1 |
Plot: Hand Strength versus Age

Plot: Hand Strength versus Weight

Plot: Pinch Strength versus Grip Strength
