 IMPROVING
PROCESSES: GAP ANALYSIS
IMPROVING
PROCESSES: GAP ANALYSISIMPROVING
PROCESSES: GAP ANALYSIS
The next major phase in a BPR exercise involves the documentation of current business processes and the formulation of future business processes, leading to a comprehensive analysis of the gaps between current and future processes. The gap analysis should: (1) provide an assessment of the barriers to change, (2) identify the "quick wins"--initiatives for the improvement of current processes that can be undertaken immediately; (3) establish the basis for the definition of major program/project initiatives; and (4) provide inputs for an analysis of benefits and costs of undertaking the required changes.
Process Mapping
To improve a process, it is first necessary to understand in some detail what currently is being done--what activities are being carried out, what relationships between activities/information flows exist, what is the "value added" of each activity. Understanding current processes will facilitate the identification of issues and the ability to communicate them to management. Determining future processes provides a "blueprint" for the policies, procedures, and organizational structure necessary to support the desired changes.
Existing processes must be described in sufficient detail to uncover any hidden pathologies. These pathologies may include inefficient work flows and sequences of activities, high costs, insignificant value added for customers, and so forth. These inadequacies have to be detected and documented. Quantitative as well as qualitative methods should be applied, depending on the nature of the pathologies. The following factors are important to take under consideration in the process documentation:
o Description of the entire process
o Identification of process elements and resources
o Current process performance
o Analytic decomposition of processes
Process mapping (or event modeling) is a BPR technique for documenting from start to finish the individual activities and key characteristics that define a process. Two tools are generally applied:
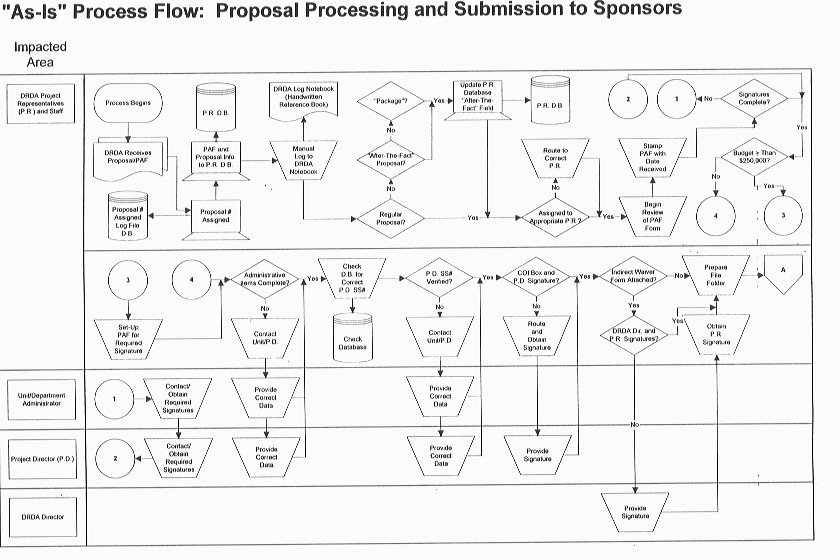
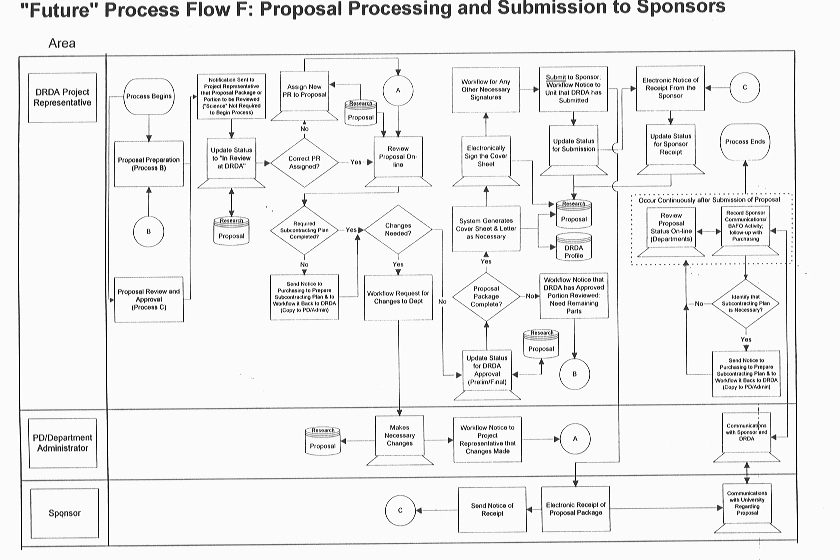
(1) Process Flows: Visual depictions showing the order of activities and the movement of information into and out of a process; and
(2) Process Profiles: Narrative descriptions which provide the detail behind the flow diagrams.
Both current and future processes should be mapped (see Exhibit 6 and 7).
Process mapping can help managers make the most effective use of both personnel and physical resources. It encourages those most closely involved in a work process to participate in determining how to use resources more efficiently. A good grasp of specific activities and their relationship to other groups helps managers make more effective decisions and leads to better relationships between units within the organization. The process mapping documentation provides an excellent basis for training packages for both management and employees. Ways to improve work flows can be determined by analyzing process mapping documents.
It may not always be possible or desirable to undertake the mapping of all processes at the outset. It may be more appropriate to concentrate on those processes that offer the potential for major improvement in terms of quality, timeliness, service enhancements, and cost savings. Such improvements should have a visible impact on the organization's performance--both in terms of the external customers and the staff members. Often these initial BPR targets are processes for which the application of technology offers significant potential gains and enhancements. In other cases, the processes selected for the BPR pilot have significant potential for positive impact on the departmental and administrative culture of the organization and/or offer major opportunities for joint interdepartmental problem-solving and interaction.
Processes are selected initially for mapping should clearly demonstrate results that are clearly measurable with objective criteria. These processes should have a high likelihood of success in terms of demonstrated results within a reasonable scope and time period. They should also evidence a high degree of commitment from a "process owner," i.e., the official within the organization with the authority to implement process change.
Several key characteristics should be identified for each process:
| Responsibilities | Key participants and their roles in the process |
| Individual Activities or Steps | Sequence of events; linakges among events; hand-offs |
| Inputs | Information/data flows; tangible items; activity triggers |
| Outputs | Key deliverables of each activity |
| Customers/Stakeholders | Recipients of outputs |
| Performance Measures | Time required to complete each activity; volume; frequency; workload/productivity |
A number of basic questions should be asked about each process: (1) What initiates the process? (2) Why do we do it? (3) What types of reviews/approvals are involved and when? (4) What is the nature, frequency, and cause of errors/problems? (5) How are problems/issues handled? (6) What is the output and where does it go? (6) How long does the process take? It is important to provide as much detail as possible about each process without compromising comprehension and readability.
The first step in process mapping is to bring together those people who understand and/or are impacted by the process. Focus groups--5 to 15 people who are knowledgeable about/or impacted by a given process--may be organized to share ideas, discuss issues, and collaborate on defining activities and their relationships within processes. More complex issues should be broken down into manageable components for discussion in these focus groups. Reference materials should be distributed prior to the group's meetings to serve as catalysis for the discussion and to provide a common facal point for the participants.
Often the same processes are performed differently by different segments within an organization. Therefore, it is important to consider all practices and to map the most representative process possible. Difference that may exist should be identified to highlight potential "best practices." Each process should be mapped at a level of detail appropriate to depict reengineering opportunities. Performance measures should be identified at this level. Links should be created between flows and profiles by using consistent names and labeling
Process maps are developed starting at a high level and driving to increasing levels of detail. The level of detail pursued depends upon the resources available, the complexity of the processes, the organization structure, the magnitude of the improvements required, project objectives, and the overall "understandability" of the processes. The levels can be described in general as follows:
| Level 1: Business Process: | Primary value-added building blocks of the organization. |
| Level 2: Process Elements: | Major steps within each business process; should be "generic" and not specific to a given unit within the organization. |
| Level 3: Functional Activities: | The principal activities that constitute each process element, representing all of the input of a single functional group to a process element. |
| Level 4: Individual Tasks: | Specific tasks within each activity, often performed by a single individual or small team. |
| Level 5: Worksteps: | Lowest identifiable discreet form of work within each task. |
In most BPR applications, the focus is on functional activities.
A process flow is created by using standard flow chart symbols. Activities should flow from left to right. If possible, flows should be limited to one page. If a process requires more than one page, it may be best to divide it into subprocesses or to use an off-page connector. It is important to keep flow diagrams simple and to label flows to clearly distinguish between current and future processes.
Profiles should be recorded using a standard template that is applicable to both current and future profiles (see Exhibit 8). Some fields may be applicable/important for the future only; it may not be necessary to complete all fields for the current process. As with the process flow diagrams, it is important to be as concise as possible but to fully document the functional activities that make up the process.
| Business Process Overview | |
| 1. | Process Objectives |
| 2. | Process Description |
| 3. | Process Owners: Responsible Individual(s) and Office(s) |
| 4. | Personnel Impacted by Process |
| 5. | Who and/or What Iniriates Process? |
| 6. | Cross Reference to Related Processes/Events |
| 7. | Pre-requisites and Dependendcies |
o Assumptions
o Process Steps
o Frequency (daily, weekly, monthly, on request)
o Total Organizational Volume
o Edits and Data Validation Requirements
o Exceptions in Process
o Interface to Information Systems(s)
o Reports
o Additional Information Produced by Process
o Workflow Routing Requirements (future only)
o Required for Approval or Information Only
o Additional Technology Requirements
o Security Rules (including rationale)
o Forms (e.g., vouchers, warrents, letters, billings)
o Related External Regulations, Policies, or Procedures
o Contractual Parameters
o Description
o Frequency
o Responsibility
| Summary of Reengineering Opportunities (current only) | |
| 1. | Description |
| 2. | Benefits |
| 3. | Time Frame (immediate, short-term, long-term) |
| 4. | Priority |
| Related Outstanding Questions/Issues |
Once the flow diagrams and profiles are completed for current processes, they should be analyzed for: (1) redundancies; (2) excessive paperwork; (3) manual operations that could be automated; (4) incidence of multiple authorizations (touches); (5) delays and bottlenecks; (6) non-value added activities; and (7) labor-intensive activities. The organizational structure should be analyzed for: (1) non-alignment with customers/end-users, and (2) unclear/misplaced responsibilities
From these analyses, baseline performance measures should be established and "quick-wins" and longer-term recommendations for improvement should be identified. Benchmarking techniques may be applied to gather more detailed targets and metrics against which to compare information about a process generated through mapping. Possible performance measures include: (1) volume of transactions; (2) number of personnel involved in the process; (3) process time; (4) elapse or cycle time; (5) delay time; (6) touch time; (7) value added; and (8) customer/end user satisfaction. Multiple measures should be applied to avoid sub-optimization.
Process time is the total amount of time a service or good is having something done to it (other than waiting). It is the sum of the touch times for the activities that comprise the process. It is measured by:
(1) Defining the volumes and estimating the percentage of work on each path (sequence of activities).
(2) Determining how much time is consumed at each step if the work goes down that path.
(3) Multiplying the total path time by the percent of work on that path and summing the results for all paths.
Cycle time (also referred to as elapsed time) is the total amount of time taken from the point at which a customer requests a service until she or he receives it. It includes process time, delay time, etc. It is measured by starting the clock the moment the service is requested (from the point of view of the customer) and stopping the clock when the service reaches the customer.
Value added analysis determines which activities in the process are most important to the customer/end-user and/or to the business strategy. Value added steps are those considered to be essential to a process. Such activities usually meet the following criteria:
o Related to doing it right the first time
o Gets the organization one step closer to delivering the product or service to the customer
o Is something the customer is willing to pay for.
Alternative designs and their possible implementations should be explored to determine the most appropriate process stricture and enabling technologies. Designing new processes is a task of constantly questioning the necessity of performing certain activities and how, if at all, they should be performed. The following guidelines should be considered when beginning to map the To Be processes:
o Start with a "clean slate" and design the process as it should be performed; break patterns and disregard "common sense"
o Align processes with strategies and performance goals
o Consider redefining organizational boundaries; do not be bound by existing strcuture of the organization; dismiss hierarchical structures
o Improve productivity by integrating fragmented work; eliminate pathologies
o Rethink roles and responsibilities to make the process work more effectively and efficiently; assign people to processes instead to single tasks
o Use technology as an enabler of change.
o Think "out of the box."
Some of the basic questions that should be raised about individual activities in formulating the To Be process models include:
o Is this activity required by the customer/end userr and will the customer pay for it?
o Could this activity be elimninated without affecting the final product or service from the customer perspective?
o Could this activity be eliminated if some prior activity were done differently?
o Does technology exist that would significantly change or eliminate this activity?
Focus groups that were organized to assist in documenting the current processes may be come vision groups in formulating the future processes.
Vision groups should be given license to be creative and to use divergent thinking so as to generate and evaluate new ideas, to challenge current assumptions, to break from exisitng paradigms, and to throw out established rules. The current organization structure should be subject to re-evaluation, and new options for the application of technology should be investigated. Tools and techniques for conducting successful focus group and vision group sessions are discussed in a subequent chapter. Suffice it to say that the underlying BPR principle--to adopt a "go-for-broke" approach, setting aside preconceived notions of how the organization views its structure and ways of doing business--is paramount in the conduct of vision group discussions.
Tools/Techniques for Gap Analysis
The next step in this phase of the BPR is to compare the current and the future processes to determine the "gap" between current approach and the desired future approach and the reasons for the divergence. Several common tools or techniques may be applied to assist in this gap analysis.
The cause and effect or "fishbone" diagram was developed in order to identify, explore and display all the possible causes of a specific problem or condition. Cause and effect diagrams are designed to focus on the cause of the problem instead of the problem itself. Like other tools, it may take a little while to become familiar with the methodology but the ease of use and power of it makes this a popular tool.
The name "fishbone" comes from what the diagram looks like. It is made up of a horizontal line (the spine) with a box at one end (the head) in which the problem is stated. Several angled lines come off the horizontal line forming the ribs of the fish. Each rib will have a probable cause of the problem listed at the end of the rib. Contributors to the cause are usually put on small branches off the rib.
There are two important limitations to the fishbone diagram:
o Due to size limitations the depth of search allowed for in the fishbone diagram cannot exceed two or three levels. Organizational problems are often very complex and, consequently, find limited success with this method.
o The fishbone diagram does not offer a quantitative mechanism with which to rank the critical variables. In other words, the fishbone does not help in identifying those variables which most significantly affect your quality.
The best use of a fishbone diagram is when a specific problem area is know to need analysis but you are not sure which portion is creating the problems. For example, customer dissatisfaction with a financial process may be identified as the head of the fishbone, with some of the spines being process inefficiencies, product outcome, issues of affordability, communication problems, and lack of customer service. Using breainsotrming techniques, each of these "spines" could be examined (possibly even doing a fishbone on them) and a determination made as to which were most instrumental in creating dissatisfaction. The focus could then be on solutions that would have the most impact on the customers.
In building a cause and effect diagram, it is important to define the characteristic that is to be improved or controlled. This characteristic should be able to be quantified and measured. Cause and effect diagrams:
o Sort and segregate possible causes of problems into a logical order.
o Identify areas for further data gathering activity.
o Help to educate participants in problem-solving processes.
o Service as guides for discussion and serve to keep meetings on target.
o Can be developed into a complete project management tool that display actions taken and results achieved.
The Pareto diagram is a fundamental tool that can be extremely effective in determining which characteristic is causing problems in your process. It is a deceptively simple, yet powerful, way of looking at data to help find the root cause of a problem. It derives its name from the work of Vilfredo Pareto, a turn-of-the-century Italian economist who concluded that a fairly consistent minority--about 20%--of people controlled the large majority--about 80%--of a society's wealth. J.M. Juran expanded on this finding to suggest that 80% of all effects are produced by only 20% of the possible causes--that is, a few root problems are responsible for the large majority of consequences.
A Pareto diagram is constructed by categorizing data, ranking it by frequency of occurrence, and plotting it in bar-chart form in descending order along the x-axis, allowing the analyst to determine the most important factor in a given situation or process. The y-axis is usually frequency of occurrence, but sometimes it can be advantageous to plot dollars on the y-axis to emphasize the cost factor. After a Pareto diagram is plotted, the data will indicate what problem is most prevalent, and what kind of leverage can gained from solving it, in addition to giving strong clues as to what is the root cause of the difficulty.
In some instances, however, the Pareto diagram will not appear to work, such as when all categories are virtually equivalent and there is only a small gain to be made by solving the "worst" one. Not all Pareto analyses produce results leading to the detection of determinate physical causes and workable solutions. However, if the analysis does not produce a readily apparent cause at a reasonable leverage, it may be possible to sorting the data using another characteristic to determine the true culprit variable.
Root Cause Analysis helps investigators describe WHAT happened during a particular event, to determine HOW it happened, and to understand WHY it happened. The three steps of Root Cause Analysis are: (1) Events and Causality Factors Charting, (2) Root Cause Coding, and (3) Recommendation Generation. A decision diagram (Root Cause Tree) is used to aid the investigator in identifying the root causes.
Forecasting seeks answers to key questions about possible and/or probable futures: (1) What happens to object A in time B if the current course of activities is allowed to continue without change? and (2) What are the likely outcomes if change C is introduced? The most primitive method of forecasting is guessing. The result may be more acceptable if the person making the guess is an expert in the matter. Guessing is the only method that makes use of tacit knowledge that the specialist is unable to express in exact words or numbers.
The best method for eliciting such an expert forecast is the unstructure interview which permits inquiry into the reasons and explanations for the presented forecast. Some things may be learned when interviewing an expert that later can be used to construct expanded forecasts through other methods. A questionnaire may be used instead of an interview when the number of experts to be consulted are numerous and/or at a distance.
In the Delphi method, identical questions are directed to a group of experts, asking for their opinions on the future development of a specific topic. A summary is made of the replies received, and this summary is sent to the respondents giving them the opportunity to revise their original responses. This procedure may be repeated several times until the responses approach some sort of consensus.
Extrapolation--the most usual method of forecasting--is based on the assumption that the course of events will continue in the same direction and with unvaryting speed (or with streadily growing or diminishing speed, i.e., a logarthmic extrapolation) until some major intervention occurs. The basis of an extrapolation is knowledge of the recent development of the phenomenon--sequential observations made at known points in time.
Statistical models, such as linear correlation and regression analysis, can be applied if the time series of observations is sufficiently large. Forecasting on the basis of statistical models often is feasible and successful even when the reason or explanation of the mathematical association found in the historical data is not known. Generally speaking, an effort should be made to determine the rational explanation behind a statistical association used as the basis of a forecast. It is always safer to forecast on the basis of a causal model than to forecast only on the basis of statistical association.
The causal model is the most accurate method of forecasting. This approach becomes possible when, through research, relationships are identified that show how the attributes and variables to be predicted depend on each other. In the best case, one of the variables in the causal model is time. When the right year is inserted, the model immediately becomes the desired forecast.