.gif)
Dr. Sanford Sillman
Research Scientist
University of Michigan
Access and download this document as PDF.
For more complete information, along with references for work cited here:
Sillman, S., Tropospheric ozone and photochemical smog. in B. Sherwood Lollar, ed., Treatise on Geochemistry, Vol. 9: Environmental Geochemistry, Ch. 11, Elsevier, 2003. http://www.TreatiseOnGeochemistry.com . For availability, contact the author.
Additional resources: The NARSTO web site contains comprehensive reviews of ozone and particulates. The American Lung Association has information about ozone, particulates and health. For other sites with information on environmental education and health effects, click here.
Ozone (O3) is the primary ingredient of photochemical smog, the type of air pollution that is associated with sunlight-driven chemical reactions. Ozone is associated in particular with the type of air pollution events that occur in Los Angeles and Mexico City, often associated with automobile emissions.
Ozone itself is colorless and invisible, but often occurs along with other, more visible species (e.g. sulfate aerosols) in large-scale pollution events.
Ozone is a pollutant of concern because it is associated with extensive health effects, most notably associated with the respiratory system. Ozone is also a pollutant of concern because it can affect both forests and agricultural crops. Ozone levels in urban areas during pollution events are believed to be high enough to affect human health. Many metropolitan areas in the U.S. are currently (2003) in violation of government health standards for ozone, and violations of health standards have been occurring since the standards were first established in the 1970's.
Pollution events with high ozone are associated specifically with sunshine and warm temperatures. High ozone is very rare when temperatures are below 20 C (68 F), and are usually associated with temperatures above 30 C (86 F). High ozone is also associated with relatively light winds and conditions that suppress vertical mixing in the atmosphere (thermal inversions or subsidence layers), but the most important conditions are sunshine and high temperatures.
Pollution events are not limited to cities. Typically, the highest ozone levels are found in suburban locations downwind from the city center, rather than in the city center itself. In some situations plumes with high ozone have been found in locations that are 500 km (300 mi) distant from the apparent emission sources. In addition, densely populated regions are subject to pollution events with uniformly high ozone, affecting both urban and rural areas. During these regional pollution events, elevated ozone may extend over an area as large as 1000x1000 km (600x600 mi). Events of this type have occurred in the eastern U.S., California and in western Europe (see Figure 1.1).
Ozone as an air pollutant should not be confused with the ozone layer in the stratosphere. Ozone occurs naturally in the stratosphere - the atmospheric layer located between 20 and 60 km (15 and 40 miles) above the earth's surface. Ozone levels in the stratosphere are 50 times higher than in the most polluted city - but no one has to breathe that air. Stratospheric ozone is beneficial to life on earth, because it blocks harmful ultraviolet radiation. Over the past 50 years human activities have caused a 5% decrease in the amount of stratospheric ozone and in particular have lead to the occurrence of an ozone hole over Antarctica during the southern hemisphere spring. This damage to the ozone layer was primarily the result of chlorofluorocarbons (CFCs), which accumulate in the atmosphere and eventually affect the ozone layer. The Montreal Protocol (1987) planned for the reduction and eventual worldwide ban on the production of CFC's. None of this relates to ozone as an air pollutant.
Ozone also occurs naturally at the earths surface, due in part to transport downward from the ozone layer in the stratosphere and in part to naturally occurring chemistry in the lower atmosphere (the troposphere). However, ozone during pollution events is approximately ten times the natural level. In addition, human activities have caused an increase in ozone at the global scale, especially in the northern hemisphere. Thus, even the most remote locations in the northern hemisphere have significantly more ozone than would occur naturally.
Ozone levels are typically expressed in parts per billion by volume (ppbV, or ppb), which represent the fraction of air molecules represented by ozone. The following are typical ozone levels (mixing ratios):
| Natural background (pre-industrial): | 10-20 ppb |
| Remote locations in the Northern Hemisphere: | 20-40 ppb (varying by season and latitude) |
| Rural areas during region-wide pollution events | 80-100 ppb |
| Peak O3 in urban areas during pollution events | 120-200 ppb |
| Maximum urban O3 (Los Angeles, Mexico City) | 490 ppb |
| Stratospheric ozone layer | 15000 ppb |
| USEPA health standard for ozone | 125 ppb, 1-hour exposure |
| (proposed revision: | 85 ppb, 8 hour exposure) |
Figure 1.1. Extent of an air pollution event. The figure shows peak ozone in the eastern U.S. on June 15, 1988 based on surface observations at 350 EPA monitoring sites. Ozone above 80 ppb extends continuously from Tennessee to Maine. The ozone plume from New York City and Boston extends to Cape Cod and along the coast of Maine. First printed in Sillman (1993).
Ozone formation is driven by two major classes of directly emitted precursors: nitrogen oxides (NOx) and volatile organic compounds (VOC). The relation between O3, NOx and VOC is driven by complex nonlinear photochemistry.
The relation between O3, NOx and VOC can be illustrated by isopleth plots (Figure 1.2), which shows peak O3 during the afternoon as a function of NOx and VOC mixing ratios or (as shown here) emission rates. As shown in the figure, it is possible to identify two regimes with different O3-NOx-VOC sensitivity. In the NOx-sensitive regime (with relatively low NOx and high VOC), O3 increases with increasing NOx and changes little in response to increasing VOC. In the NOx-saturated or VOC-sensitive regime O3 decreases with increasing NOx and increases with increasing VOC. The dotted line (the ridge line) represents a local maximum for O3 versus NOx and VOC, separates the NOx-sensitive and VOC-sensitive regimes.
The response of ambient O3 to reductions in emissions of NOx and VOC is also shown in results for indicator ratios ( Observation-based methods, Figure 2.1 ).
WARNING: The exact dependence of O3 on NOx and VOC in isopleth plots varies greatly depending on assumptions and conditions used in generating the isopleth plot. The pattern (with a split into NOx-sensitive and NOx-saturated regimes) tends to recur for a wide range of conditions, but the values of VOC and NOx associated with the transition between regimes change.
Ambient NOx and VOC mixing ratios are directly related to the instantaneous rate of production of O3, and it may be possible to make inferences about the instantaneous production rate of Ox based on ambient NOx and VOC. A more robust form of the isopleth plot can be created by plotting the instantaneous rate of production of O3 versus summed ambient VOC and NOx, where the VOC sum is weighted by reactivity. This is discussed in the report on Observation-based methods , elsewhere at this site.
.jpg)
Figure 1.2. Ozone isopleths (ppb) as a function of the average emission rate for NOx and VOC (1012 molec. cm-2s-1) in 0-d calculations. The isopleths (solid green lines) represent conditions during the afternoon following 3-day calculations with a constant emission rate, at the hour corresponding to maximum O3. The short blue dashed line represents the transition from VOC-sensitive to NOx-sensitive conditions. From Sillman and He (2002).
O3-NOx-VOC sensitivity for individual locations and events are often very uncertain (see 1.2.3. below). Generalizations about NOx-sensitive versus VOC-sensitive conditions are always very approximate and subject to many exceptions. The following are offered as broad guidelines for understanding the factors that cause O3-NOx-VOC sensitivity to vary for different locations and for different events.
WARNING: VOC/NOx ratios are associated with the instantaneous production rate of O3, not necessarily the ambient O3 mixing ratio. Ambient O3 is the result of photochemistry and transport over several hours (and often several days), and ambient VOC and NOx can vary greatly over time and through the upwind region in which the ozone was produced.
WARNING: There are likely to be many exceptions to this rule. NOx-sensitive conditions are possible even in an urban center, and VOC-sensitive conditions can occur even at far downwind locations (Jacob et al., 1995; Kleinman et al., 2000)
The split between NOx-sensitive and VOC-sensitive chemistry is a major source of uncertainty in predictions for the relation between O3 and precursor emissions.
NOx-VOC sensitivity is difficult to predict, and there are no simple "rules of thumb" for distinguishing NOx-sensitive from VOC-sensitive conditions. O3-precursor sensitivity predictions are usually derived from 3-dimensional Eulerian chemistry/transport models. These models are subject to many uncertainties that affect their ability to identify NOx-sensitive vs. VOC-sensitive conditions. Different assumptions in models may lead to very different results for predicted sensitivity to NOx and VOC.
Emission inventories are often the largest source of uncertainty in model sensitivity predictions. O3-precursor sensitivity depends critically on emission rates for anthropogenic VOC and NOx, on the speciation of anthropogenic VOC, and on emission rates for biogenic VOC.
Evaluation of chemistry/transport models is usually based on the ability of the model to predict O3 in comparison with ambient measurements. However, success in simulating the observed Ox does not guarantee that models predict the O3-NOx-VOC sensitivity correctly. Frequently it is possible to create different model scenarios for an event that give similar O3 but with very different predictions for NOx-VOC sensitivity (Sillman et al., 1995, Reynolds et al., 1996, Pierce et al., 1998).
Effect of uncertainty. Figure 1.3 illustrates the uncertainty in predictions for the impact of reduced NOx and VOC. The figures show the reduction in peak O3 resulting from reduced NOx and VOC, as predicted by a series of different model scenarios for two days in Atlanta. On the first day, a 35% reduction in NOx emissions is predicted to cause changes in peak O3 ranging from a 23 ppb decrease to a 2 ppb increase, depending on which model scenario is chosen. Similarly, a 35% reduction in anthropogenic VOC is predicted to cause changes in peak O3 ranging from a 23 ppb reduction to a 2 ppb reduction. This range of uncertainty occurs because the model chemistry may be predominantly NOx-sensitive or predominantly VOC-sensitive, depending on assumptions about emission rates and meteorology. Uncertainties are less on the second day (12-29 ppb reduction in O3 for reduced NOx; 0-11 ppb reduction for reduced VOC) because model uncertainties do not cause a switch from NOx-sensitive to VOC-sensitive chemistry.
Observation-based methods (OBMs) can be used to reduce the uncertainty in predictions for the impact of reduced NOx and VOC on O3. OBMs may provide an independent observation-based estimate for the relative impact of NOx and VOC. The most important use of OBMs is to provide an observation-based evaluation and constraint on chemistry/transport models, in order to reduce the uncertainty in NOx-VOC predictions shown in Figure 1.3.
.jpg)
(a) August 10, 1992
Figure 1.3. Impact of model uncertainty on control strategy predictions for O3 for two days in Atlanta, GA. The figures show the predicted reduction in peak O3 resulting from 35% reductions in anthropogenic VOC emissions (crosses) and from 35% reductions in NOx (solid circles) in a series of model scenarios with varying base case emissions, wind fields and mixed layer heights. Results are plotted from tabulated values published in Sillman et al. (1995, 1997).
Ozone formation occurs through the following sequence of reactions. The sequence is almost always initiated by the reaction of various VOC or CO with the OH radical [R1, R2]. This is followed by the conversion of NO to NO2 (through reaction with HO2 or RO2 radicals), which also regenerates OH [R3, R4]. NO2 is photolyzed to generate atomic oxygen, which combines with O2 to create O3 [R5, R6].
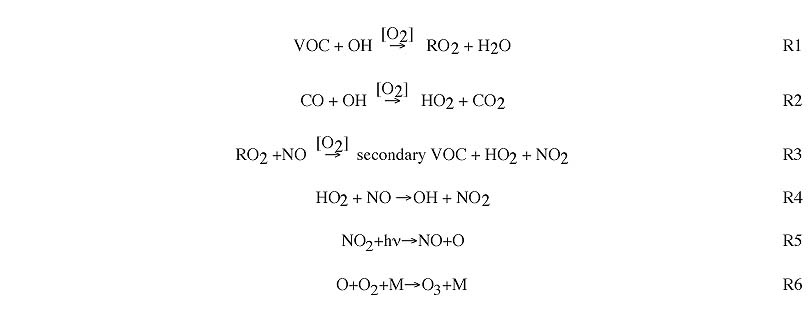
Here, RO2 represents any of a number of chains of organics with an O2 attached (replacing H in the original chain). For example: propane (C3H8) reacts with OH [R1] to generate the following RO2: C3H7O2. This reacts with NO [R3] to generate C2H5CHO (propionaldehyde) and H (which combines with O2 to form HO2).
The rate of ozone formation is controlled primarily by the rate of the initial reaction of VOC with OH.
NOx titration: Elevated ozone in polluted regions is usually due to the ozone production sequence shown above. However, at nighttime and in the immediate vicinity of very large emissions of NO (e.g. power plants), ozone concentrations are depressed through the process of NOx titration. This consists of the removal of O3 through reaction with NO [R7].

During the daytime, this reaction is normally balanced by the photolysis of NO2 [R5, R6]. However, in the vicinity of large NO emissions the result is net conversion of O3 to NO2. This is most common in the vicinity of large point sources. Ozone is depressed immediately downwind of these sources, and beomes elevated as the plume moves further downwind (Gillani et al., 1996).
At nighttime, there is no photolysis of NO2 reaction R7 also leads to the removal of ozone.
NOx-sensitive vs NOx-saturated: The split between NOx-sensitive and NOx-saturated regimes, illustrated in Figure 1.2, is driven by the chemistry of odd hydrogen radicals. There are two main sinks for these radicals: peroxides and nitric acid (HNO3). When peroxides represent the dominant radical sink, chemistry is NOx-sensitive. when HNO3 represents the dominant sink, conditions are NOx-saturated. This is described in more detail immediately below.
Odd hydrogen radicals consist of OH, HO2 and species with the form RO2. This family is directly connected to the chemistry of ozone production, because the initial reaction of the ozone production sequence (VOC+OH, R1) is driven by OH and susequent steps depend on HO2 and RO2. The ozone production rates depend on the abundance of OH, which depends on sources and sinks of odd hydrogen radicals as a whole.
Radical sources include photolysis of ozone, formaldehyde, and other secondary VOC.

Radical sinks include formation of hydrogen peroxide (R10) and organic peroxides (R11) , formation of nitric acid (R12) and net formation of peroxyacetyl nitrate and other organic nitrates.

NOx-sensitive regime occurs when peroxides (R10 and R11) represent the dominant radical sink. In this case, ambient concentrations of HO2 and RO2 radicals will be determined by the balance between radical sources (R8 and R9) and the peroxide-forming reactions (R10 and R11). Because the rate of peroxide formation is quadratic in HO2, the ambient concentrations of HO2 and RO2 show little variation in response to changes in NOx and VOC. The rate of ozone formation is determined by the reaction of HO2 and RO2 with NO (R3 and R4). This rate increases with increasing NOx. In polluted regions the rate of ozone formation usually is relatively unaffected by changes in VOC. In remote regions the rate of ozone formation also increases with increasing VOC.
NOx-saturated (VOC-sensitive) regime occurs when nitric acid (R12) represents the dominant radical sink. In this case, ambient concentrations of OH will be determined by the balance between radical sources (R8 and R9) and the reaction of OH with NO2 (R12). Because the rate of nitric acid formation (R12) increases with NO2, ambient OH decreases with increasing NO2. The rate of ozone formation is determined by the rate of the reaction of VOC and CO with OH (R1 and R2). This rate increases with increasing VOC and decreases with increasing NOx.
VOC/NOx ratios: The split between NOx sensitive and VOC-sensitive regimes is closely related to the ratio of summed VOC to NO2, assuming that the sums are weighted by reactivity (rVOC/NO2).
The formation rate of ozone and the radical source term [R9] both increase with increases in the rate of the reaction of VOC with OH [R1].
The rate of formation of nitric acid, a critical radical sink, depends on the rate of the reaction of NO2 with OH [R12].
The ratio of radical sources to the formation rate of nitric acid (as a radical sink) is proportional to the ratio of summed VOC (weighted by reactivity with OH] to NO2. When this ratio is high, peroxides become the dominant radical sink and conditions are NOx-sensitive. When this ratio is low, nitric acid becomes the dominant radical sink and conditions are NOx-saturated.
WARNING: VOC/NOx ratios are associated with the instantaneous production rate of O3, not necessarily the ambient O3 mixing ratio. Ambient O3 is the result of photochemistry and transport over several hours (and often several days), and ambient VOC and NOx can vary greatly over time and through the upwind region in which the ozone was produced.
Ozone production efficiency per NOx is equal to the ratio of the rate of ozone formation to the rate of removal of NOx (largely by chemical conversion to HNO3). The ozone formation rate is proportional to the rate of the reaction of VOC with OH. The conversion of NOx to nitric acid is proportional to the rate of the reaction of NO2 with OH. The ozone production efficiency is equal to the ratio of these rates. Therefore, it is also related to the ratio of summed VOC(weighted by reactivity with OH) to NO2.
.jpg)