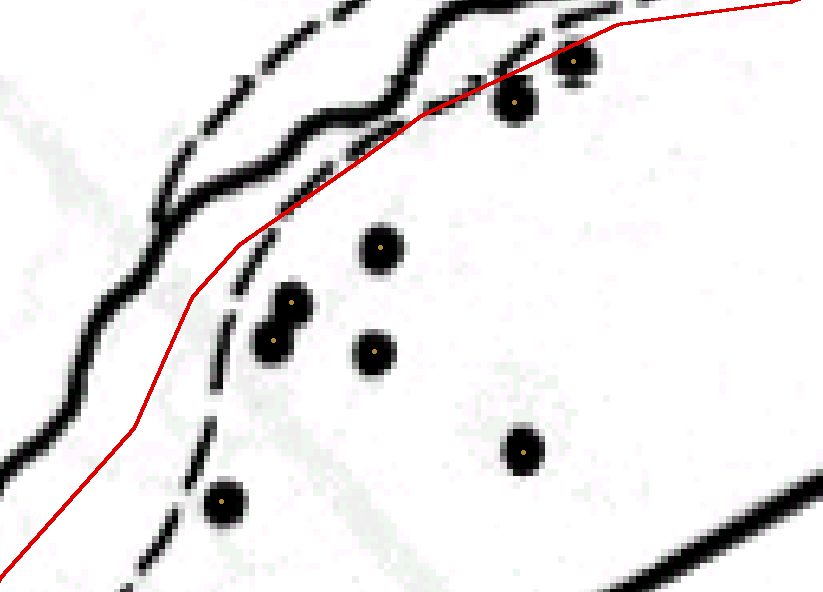
Original Scanned Image (left) vs. Image Rendered through ArcView (right)
GIS Analysis of Cayhuamarca Period Archaeological Sites in the Santa Valley, Peru
Methodology
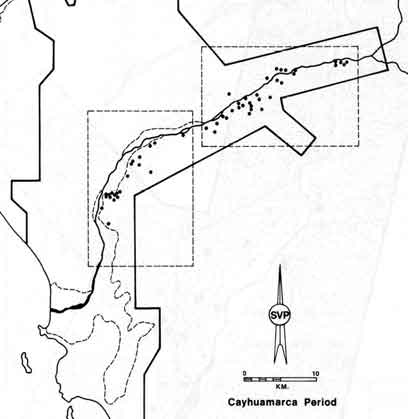
I first scanned in Wilson's map of Cayhuamarca sites (Wilson 1988, Fig. 22, pg. 101) as a .bmp file., with 150 dpi resolution. Then by using the Image to Map Register extension for ArcView 3.2, I was able to roughly "fit" the scanned image under the .shp file provided by Digital Chart of the World. I picked 6 pairs of points from the two maps, such as where the river meets the coastline, places where the river bends, and where the river splits into two tributaries, to match the bitmap with the shape file. Even with an RMS value to less than 0.02, there was still some mismatch between the rectified image (the scanned image) and the registered map (the .shp file).I therefore had to use EdTools extenstion to slightly "slide" the registered map in order to achieve better correspondence with the rectified image. I felt enough accuracy had been reached when all the sites on the rectified image were on the same side of the river in as in their original location. In other words, if certain sites were on the south side of the river in the rectified image, then they should alse be on the same side of the river in the registered map. The next step involved placing points on the registered map for purposes of analysis; the points were inserted in the center of the sites on the rectified map, which appeared as large black dots when zoomed in.
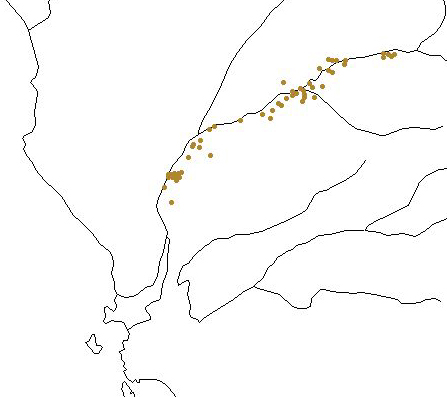
The rectified image overlapping the registered map. The large black dots are the sites on the rectified image, and the small brown dots (in the center of the black dots) are the new points I created on the registered map. The red line is river on the registered map, which is about 0.63 km south of the actual river on the recitified image, as represented by the thicker black line.
I have not attempted to make estimations of the degree of error. However, I compared the intersite distances between the scanned image and the registered map, and they often come out to be less than 0.01 km. It should be noted that the purpose of this analysis is to obtain broad spatial patterns between the sites, rather than providing future archaeologists who wish to re-discover these sites with the exact geopositioning information.Finally, data pertaining the size, type, and population estimate for each site were entered. If the site was a citadel (defensive in function), then more detailed information, such as shape of fortification, number of walls, etc., was included in the database. These data could be found on pg.536-540 in Wilson's report.
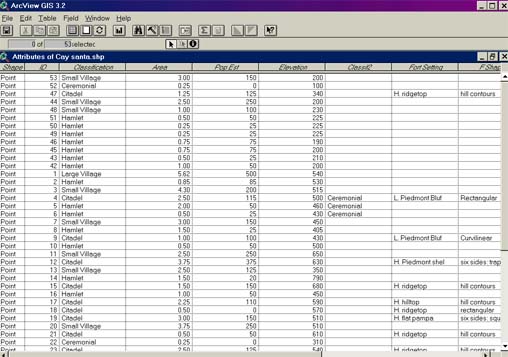
Table of site data in ArcView