IV. Bus Users
Samples from DAS data (N=380)
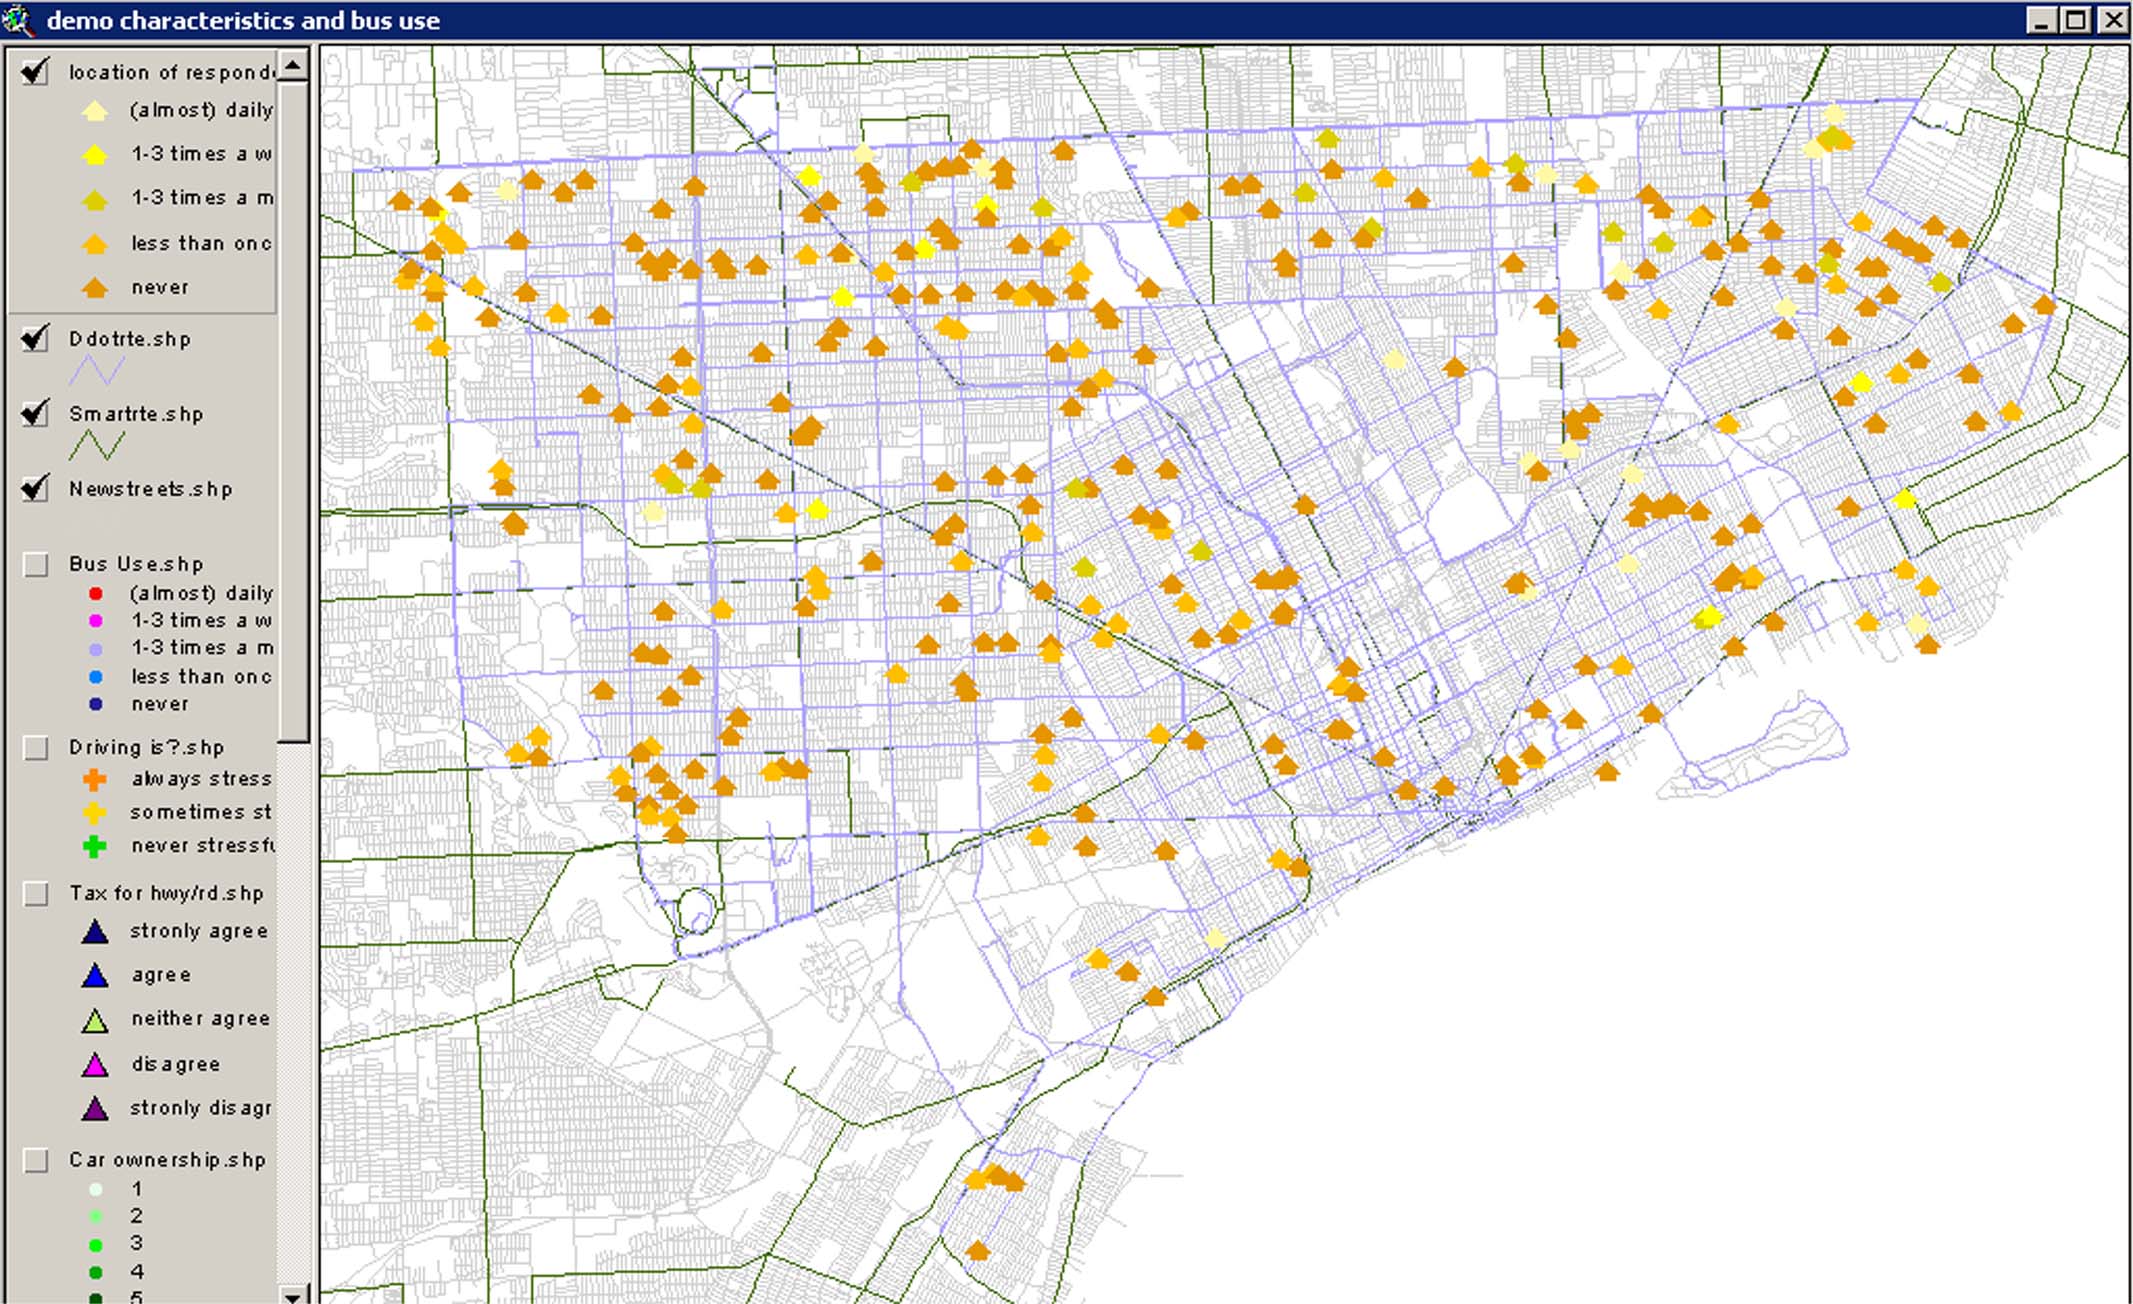
Frequency of bus use by 380 respondents living in Detroit is shaded in yellow to orange. Yellow color represents frequent users, and orange color represents non-frequent users or non-users.
Number of car owned by respondents
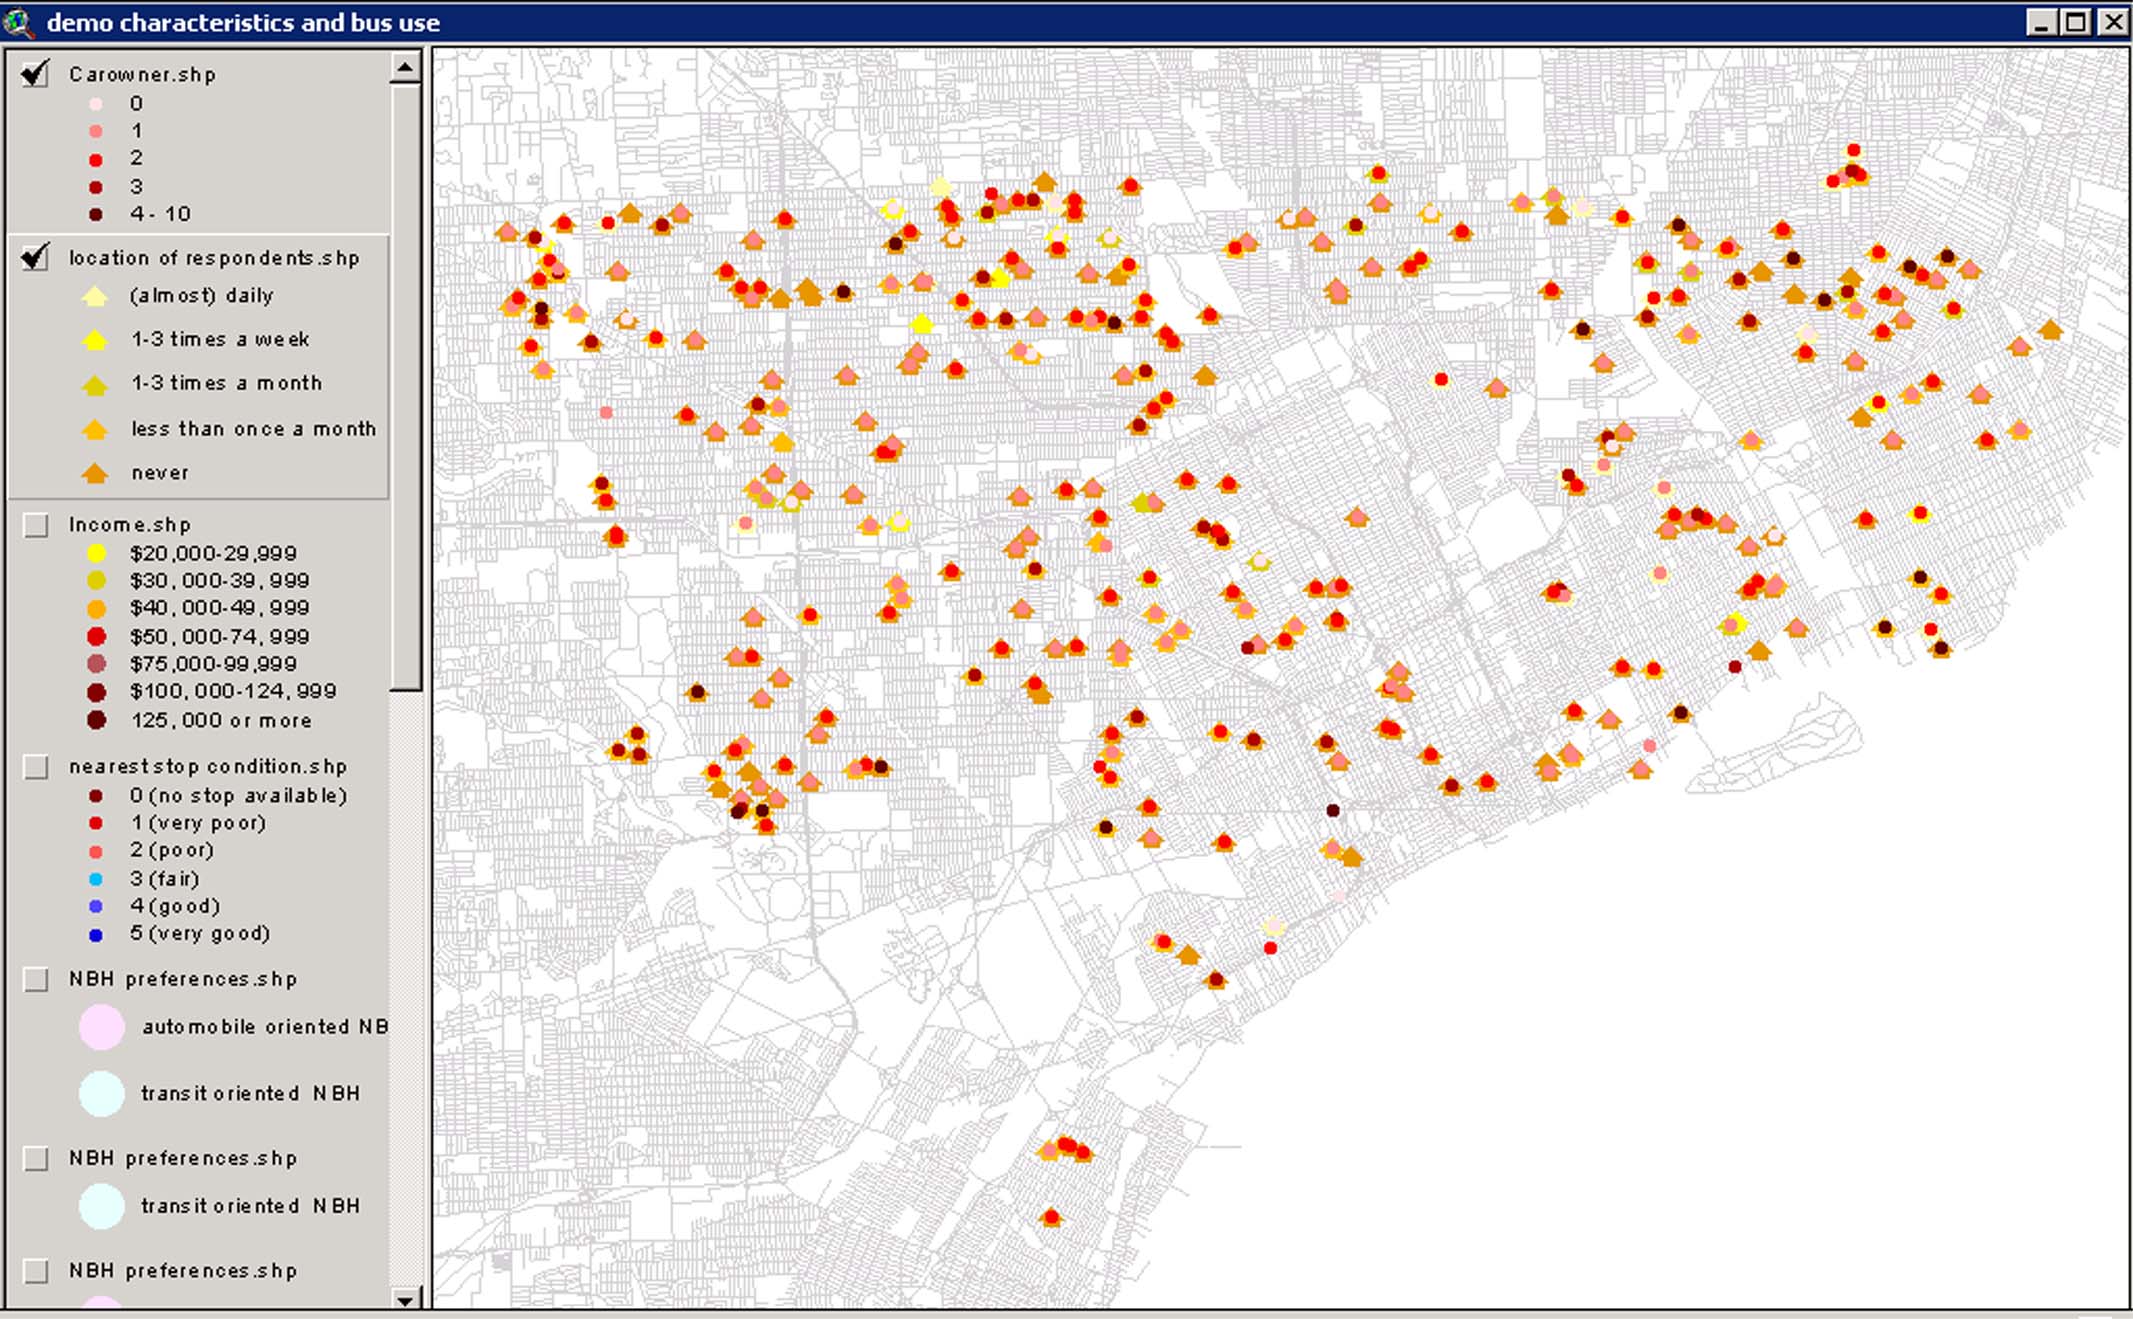
Most people (249 respondents) possess one or two cars in their household and 19 people have no car while 20 people have more than 4 cars. More than 4 car households, represented as darker dots, rarely or never use bus transportation.
Near bus stops of respondents
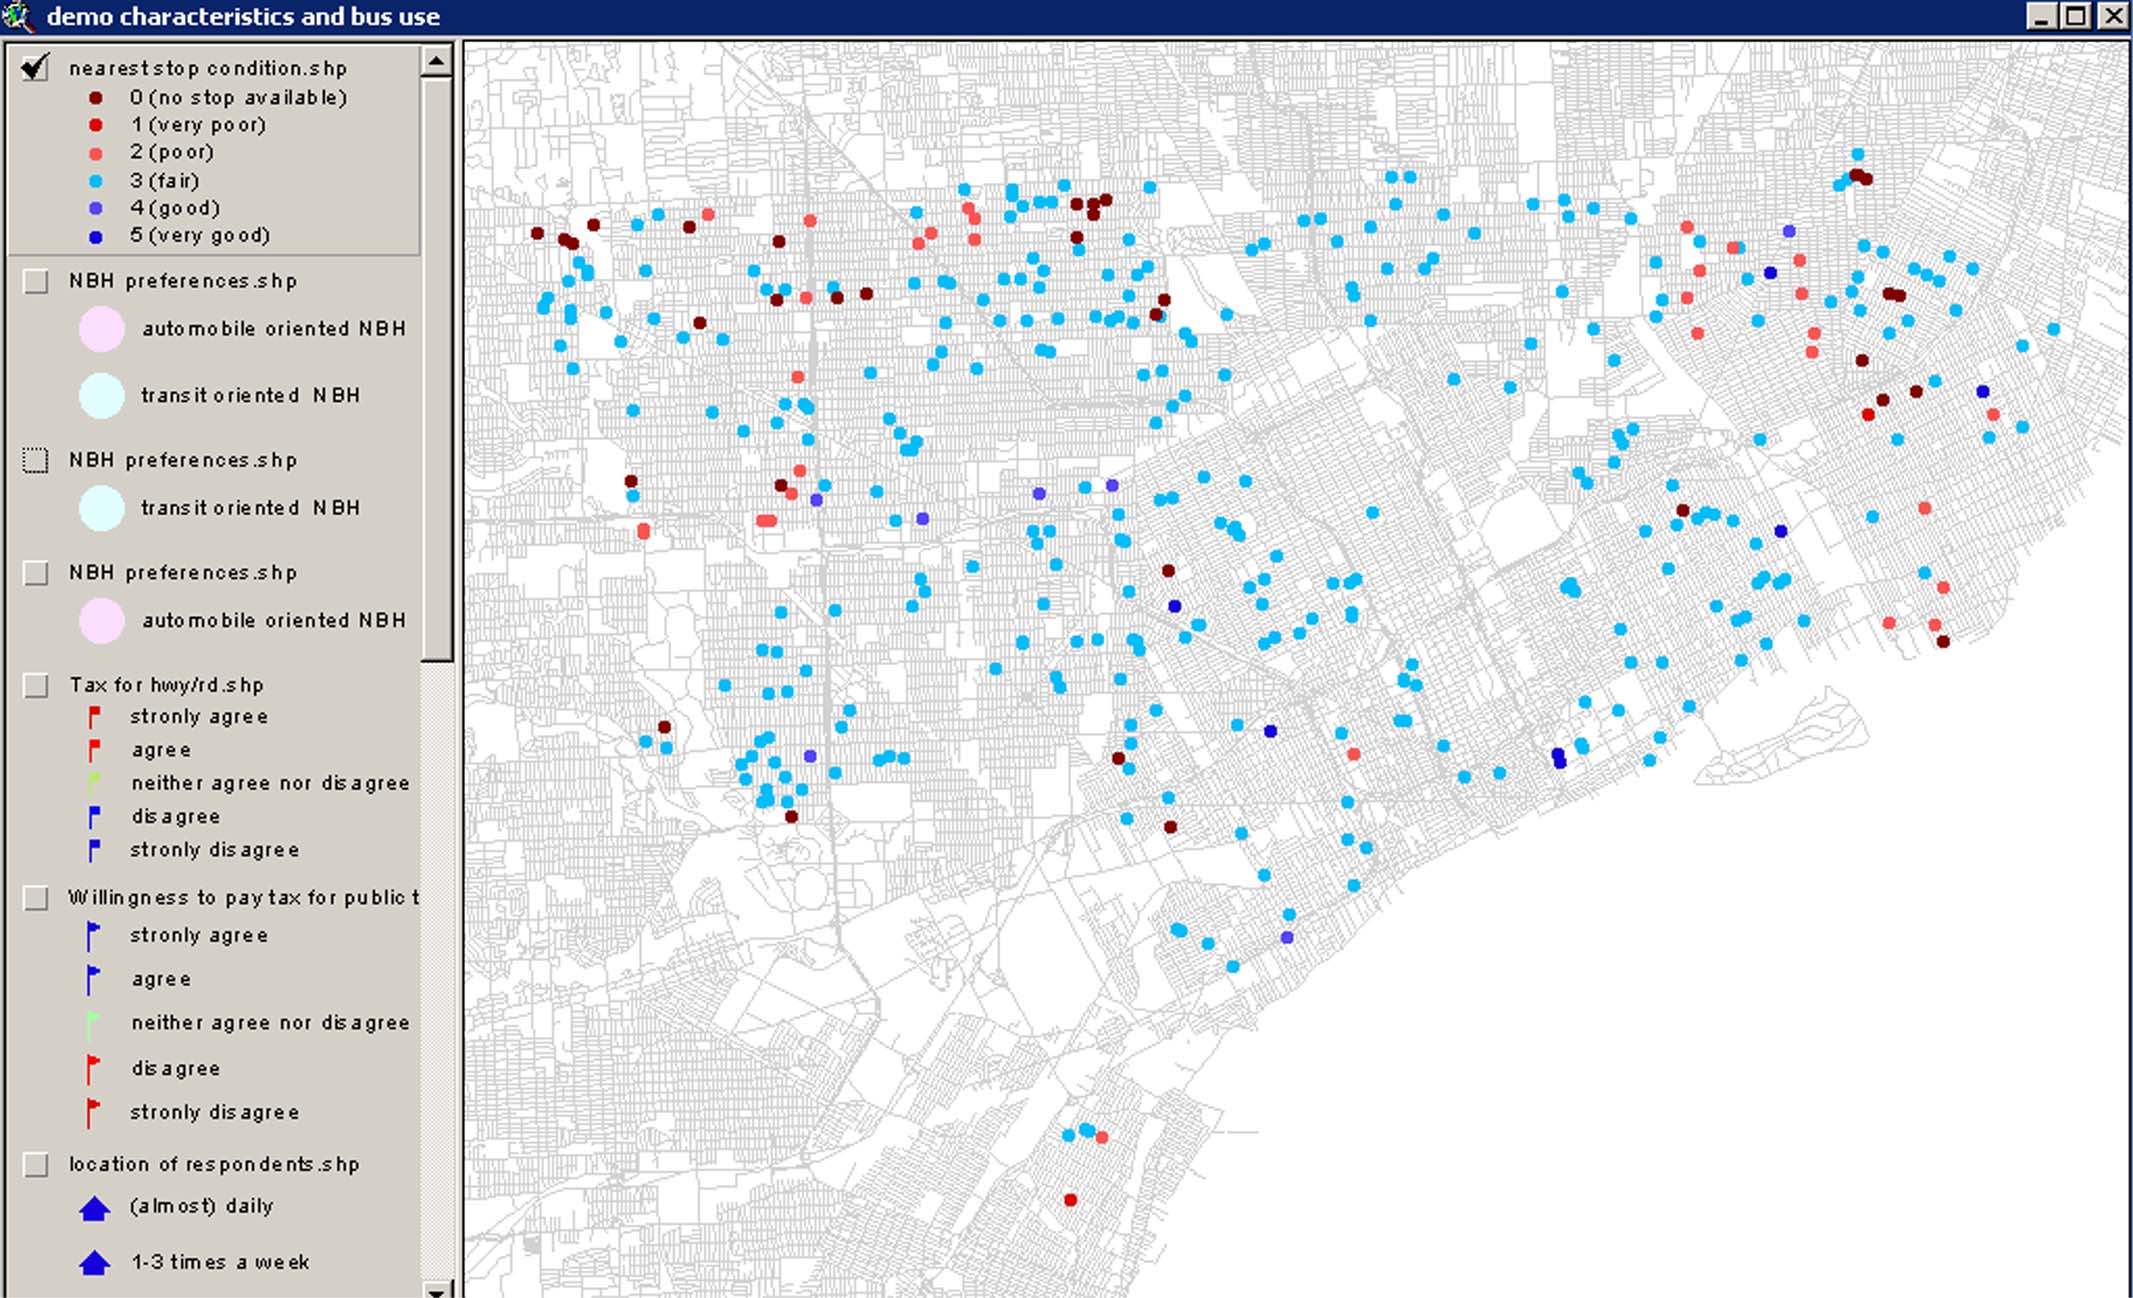
The dots represent the nearest bus stops within 0.25 mile from respondents. Bus stops of 313 residents are in fair or good condition. Yet, 35 residents have no bus stops with 0.25 mile. Among total 2101 stops within the buffer zone, 1362 bus stops are scored 3, which is fair condition. However, 642 stops are in poor condition.
Nearest bus stop condition and Preferences
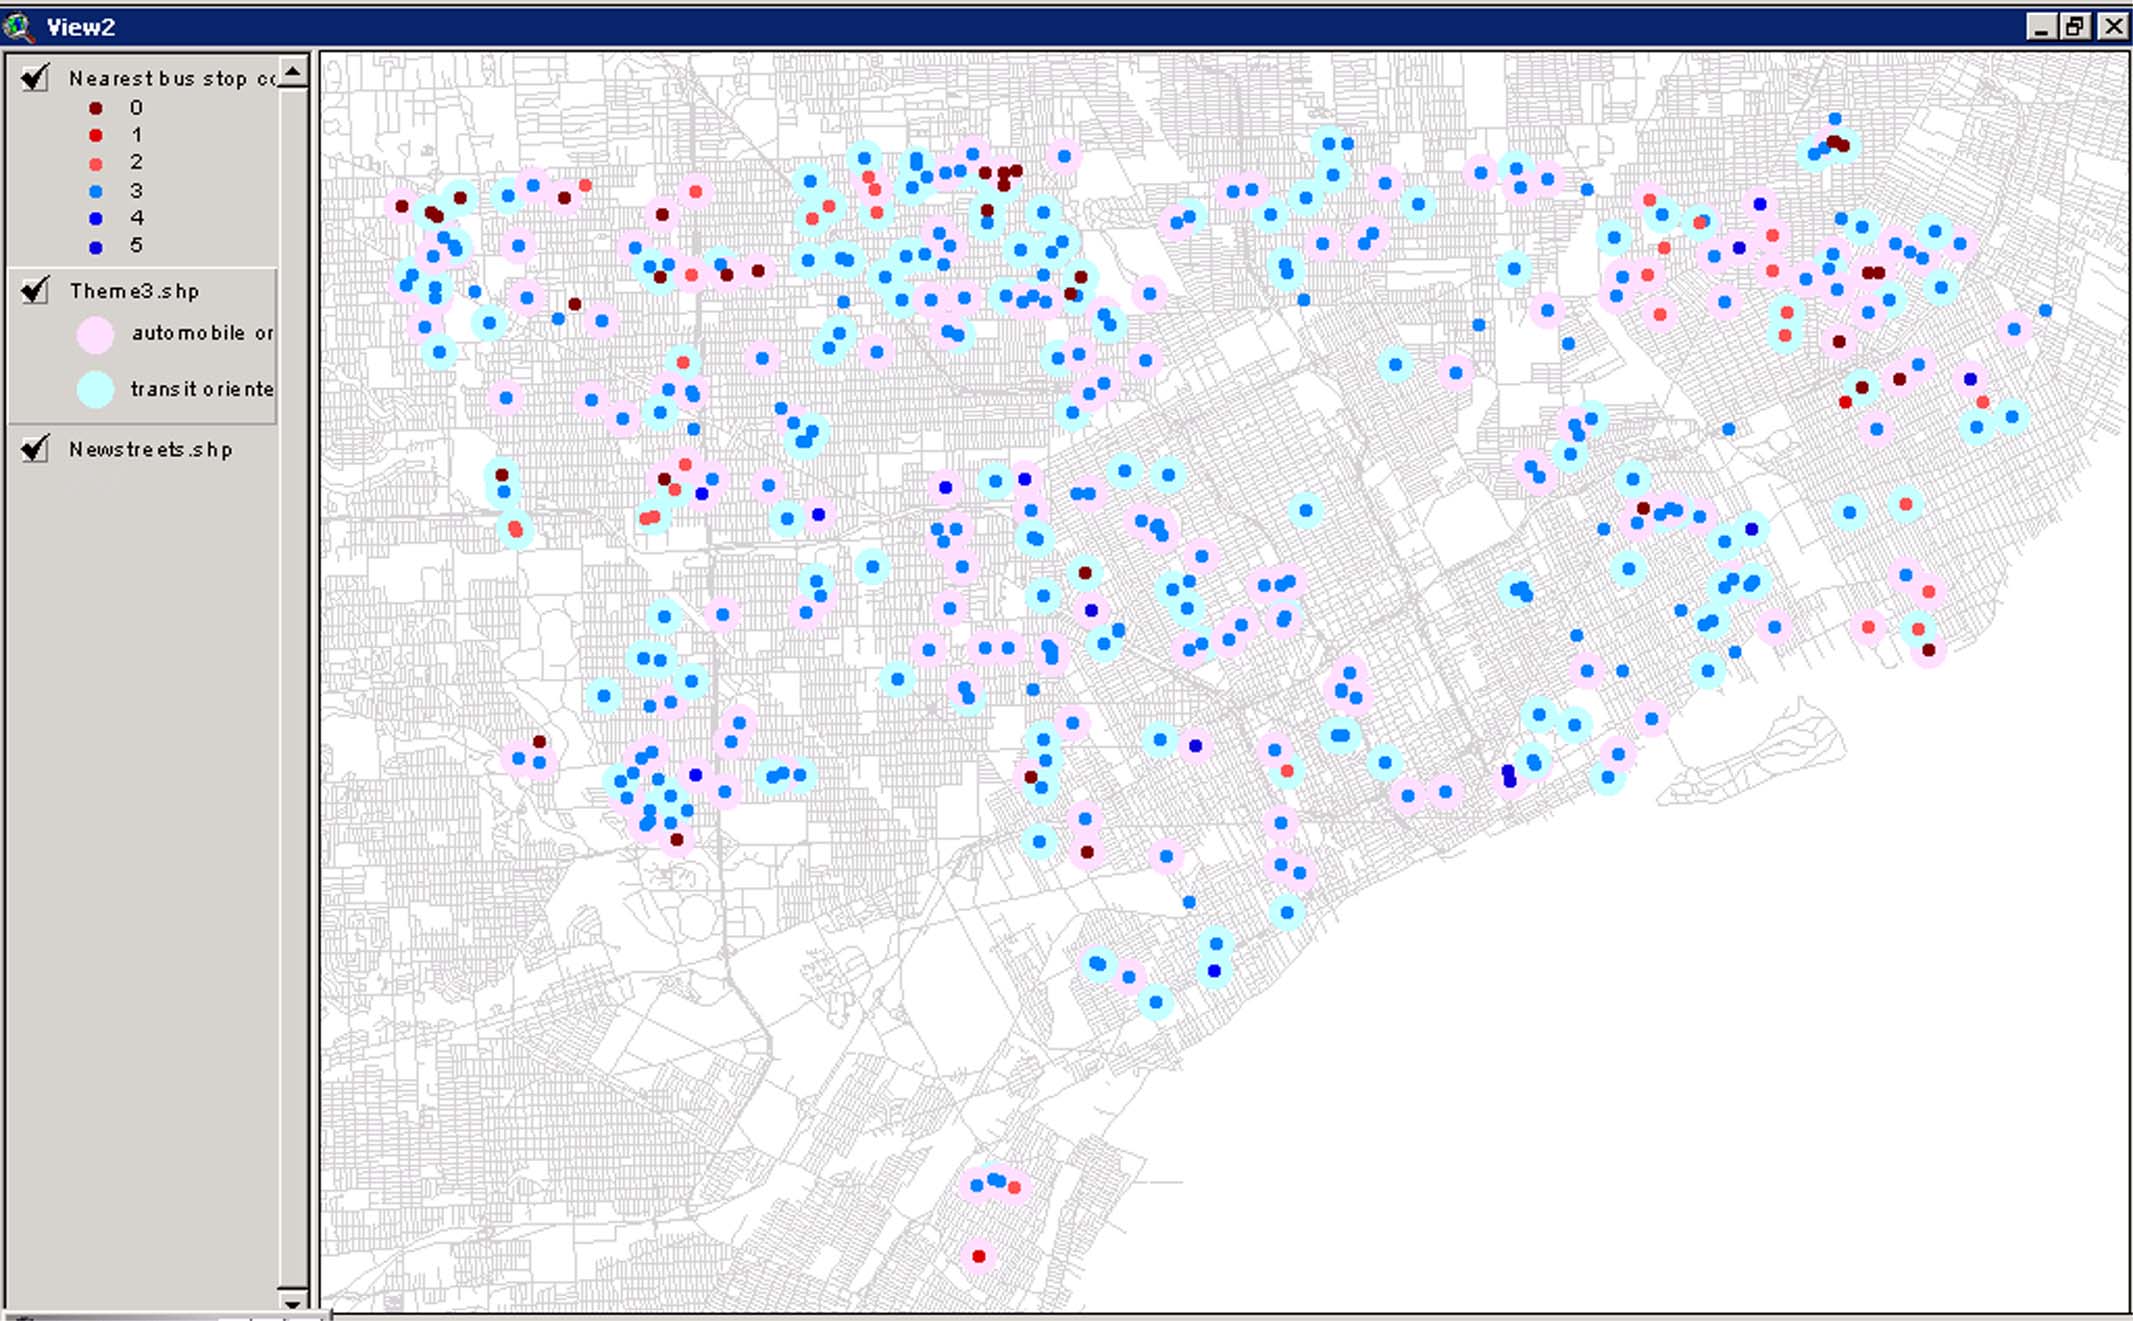
Burgundy dots: No bus stop nearby
Red shaded dots: Poor bus stop conditions
Blue shaded dots: Fair or good conditions
Pink circle: Automobile oriented neighborhood preffered
Light blue circle: transit oriented neighborhood preffered
Feeling of Stress during driving to commute
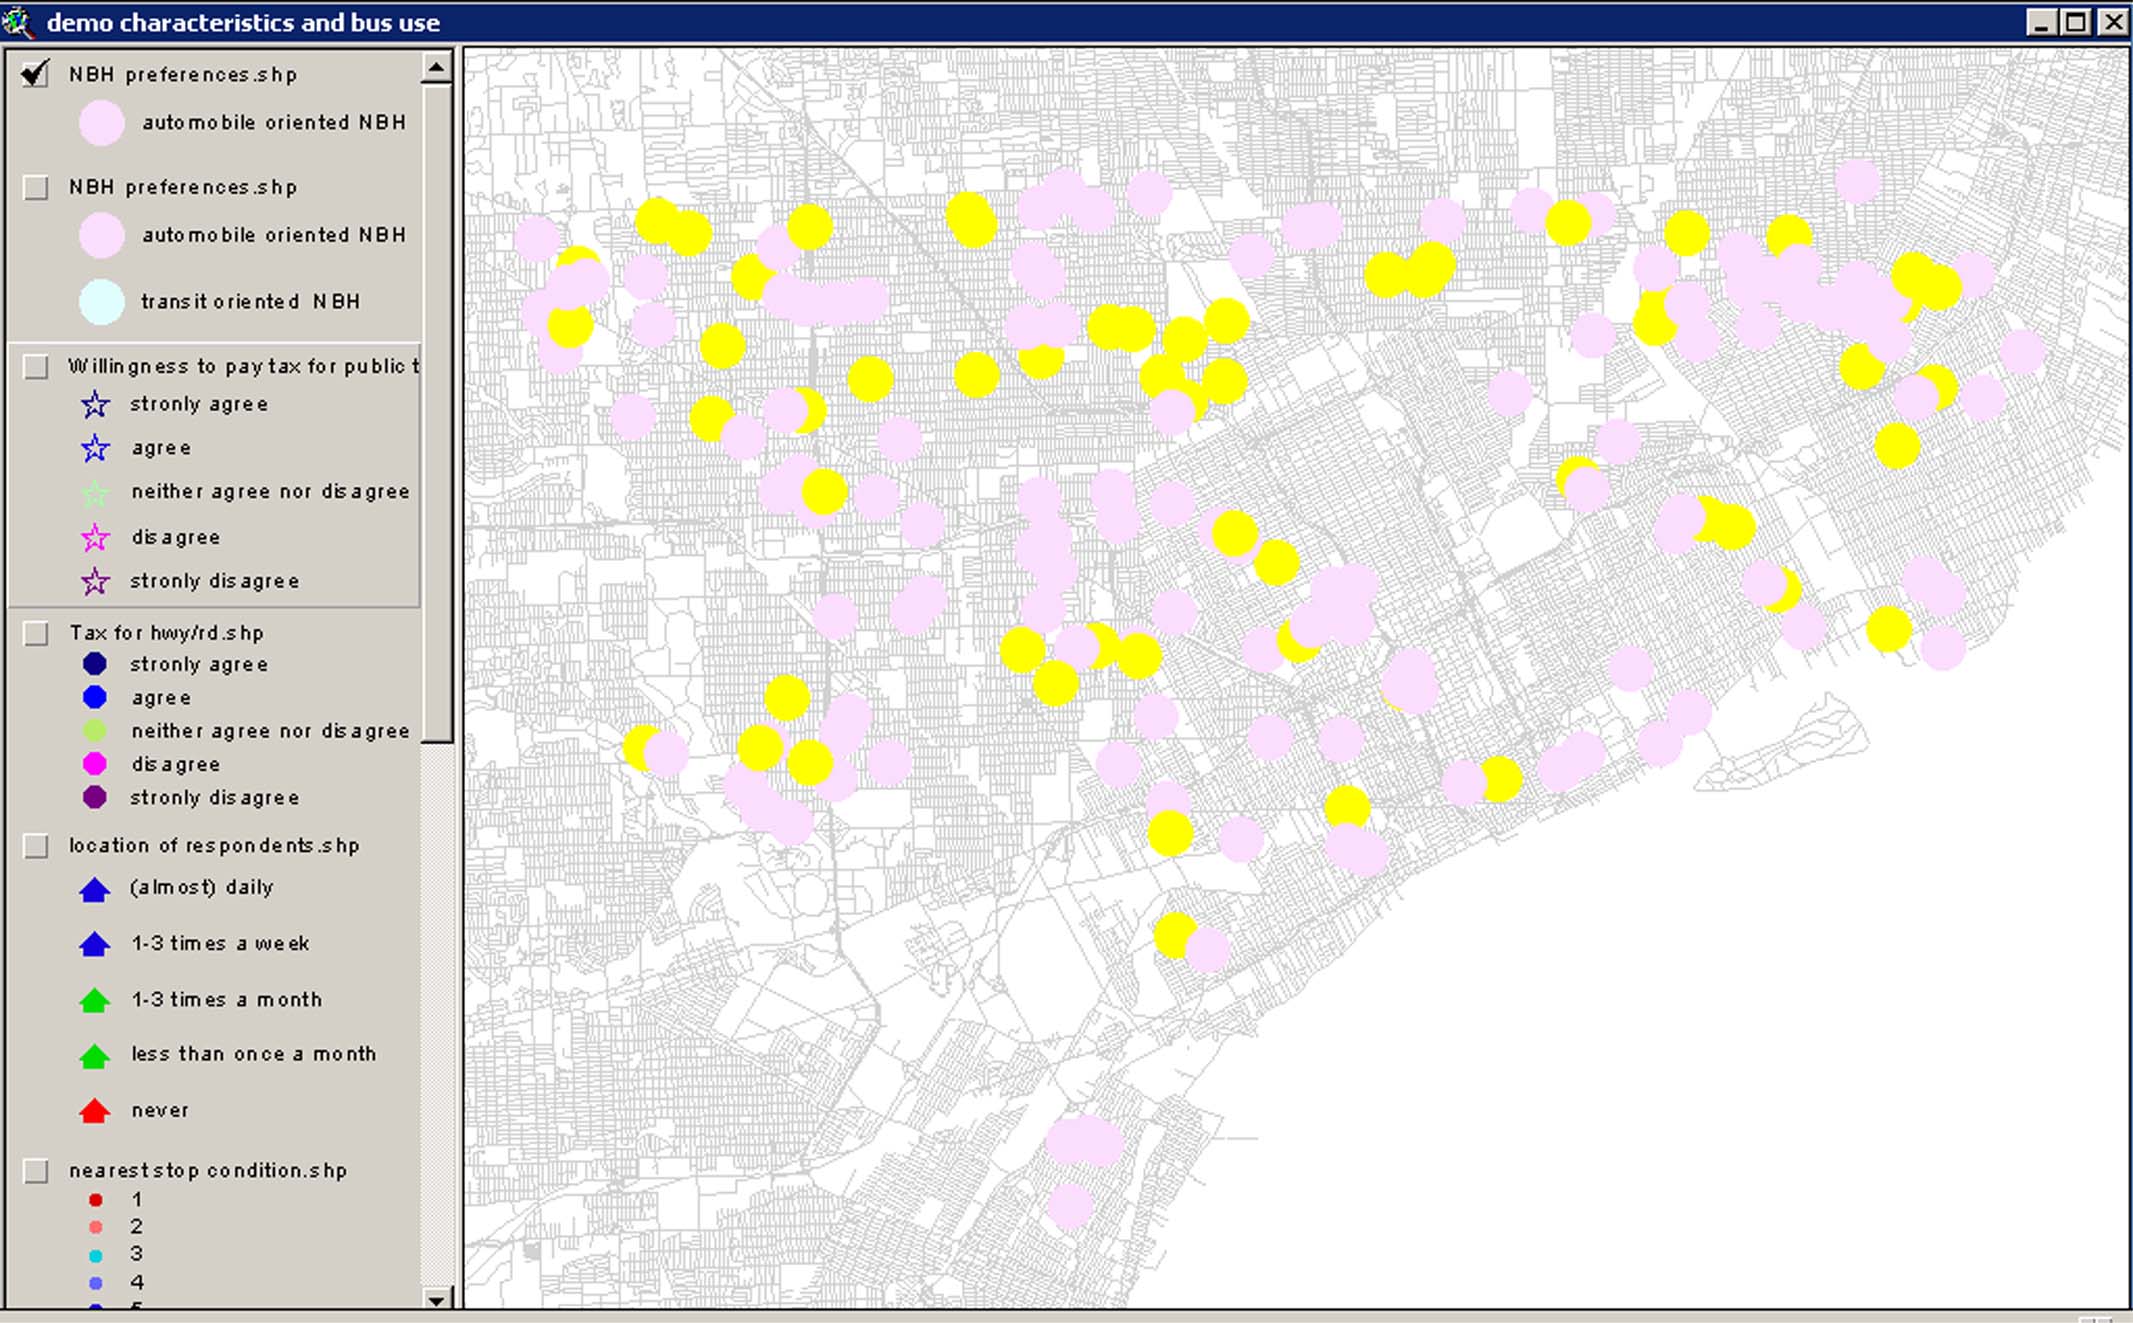
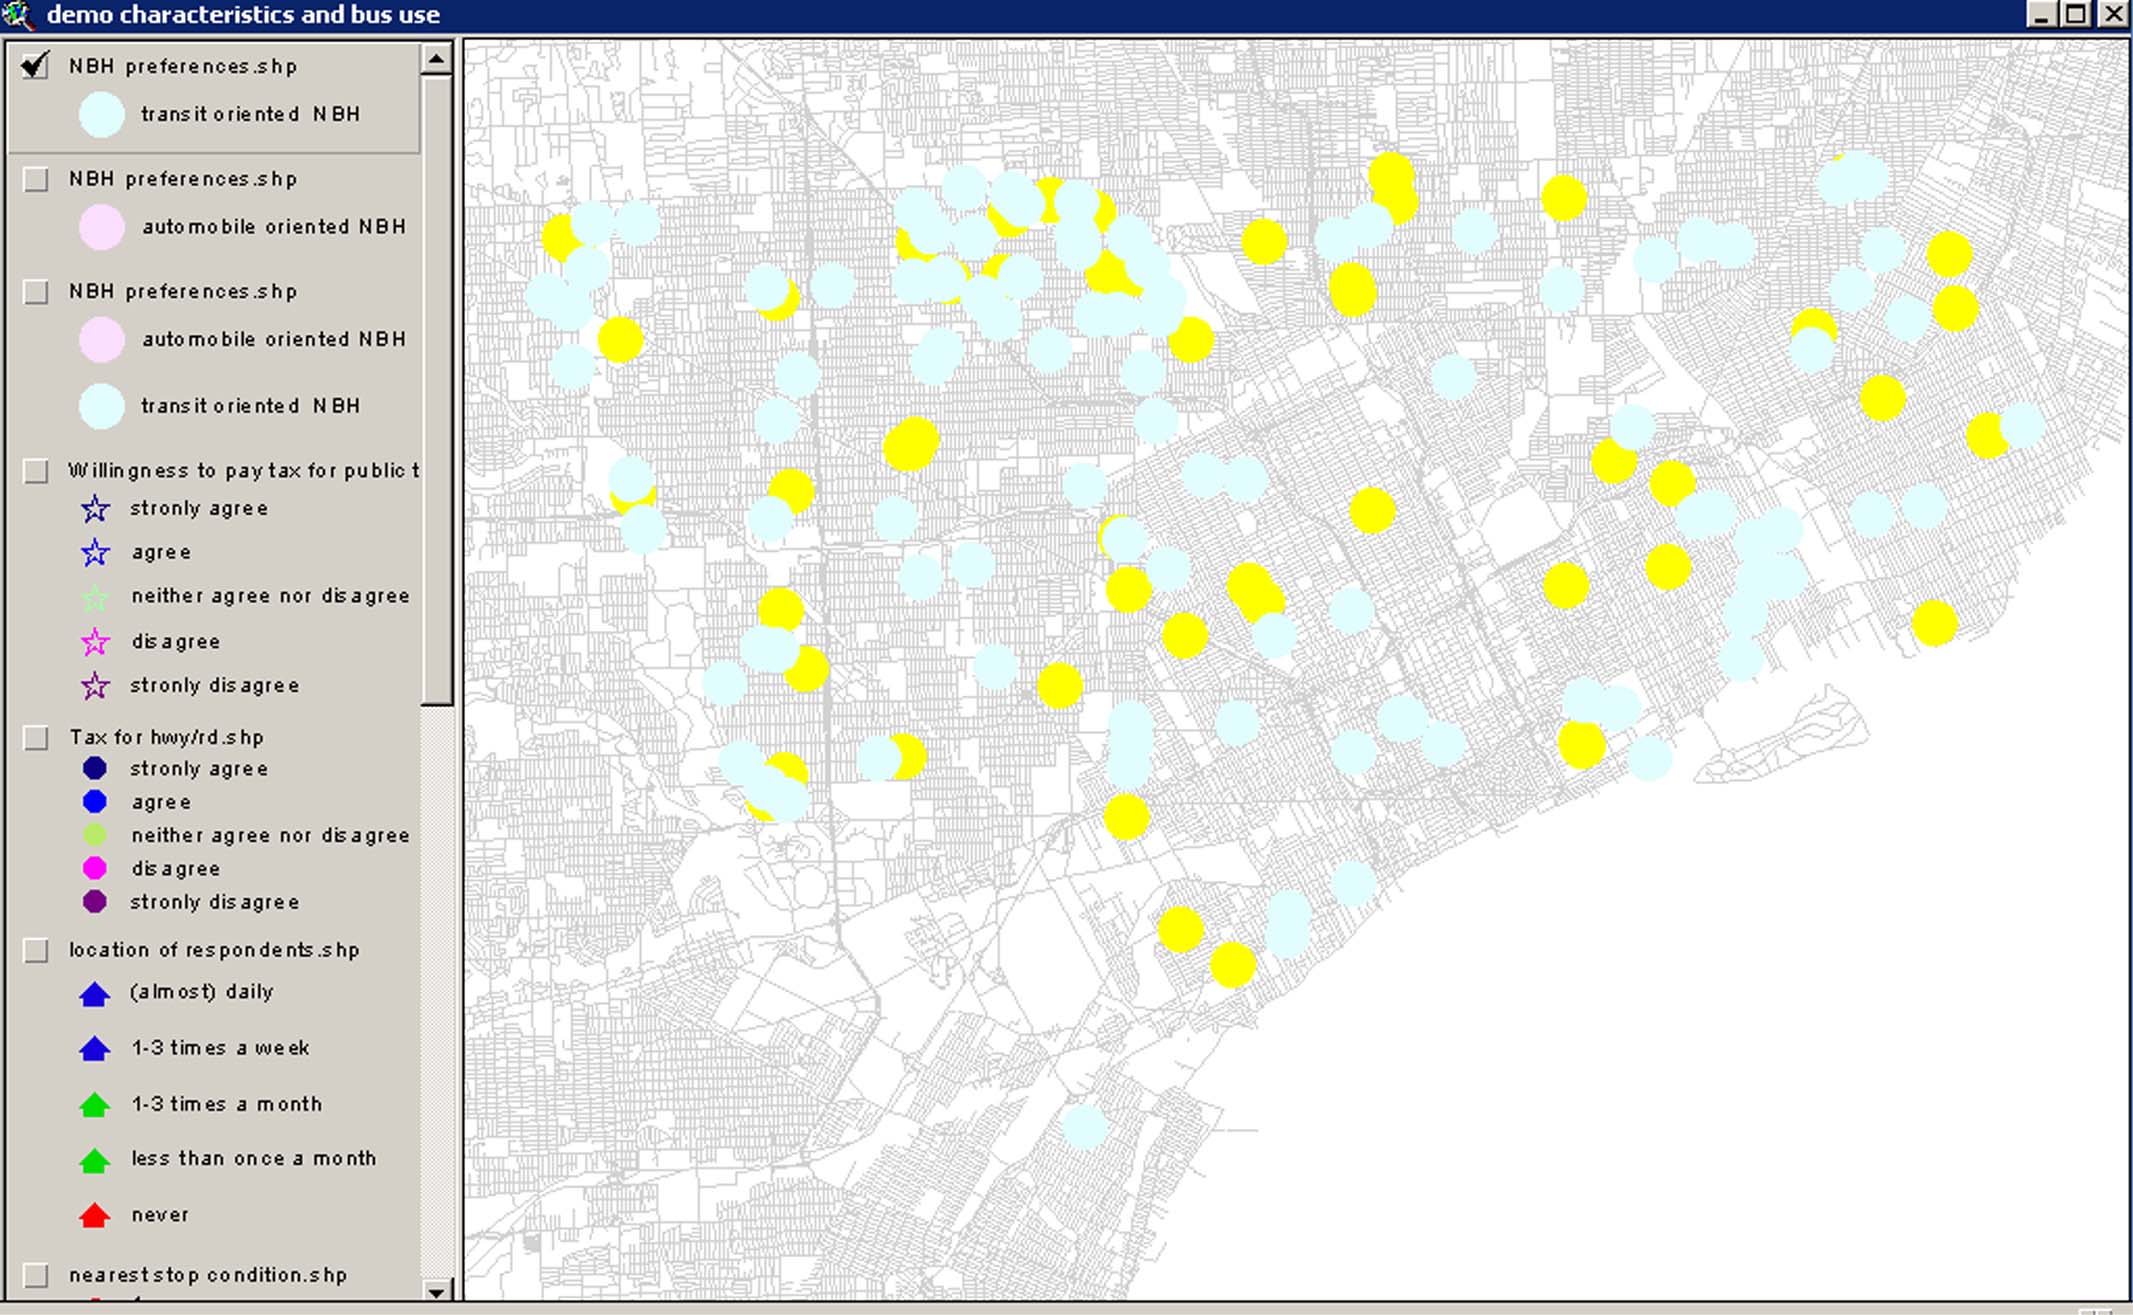
Auto-oriented NBH preferences vs. Transit-oriented NBH preferences
Yellow shaded circles indicated people who are always or sometimes stressful during driving to work or school.
Willingness to pay taxes for public transportation
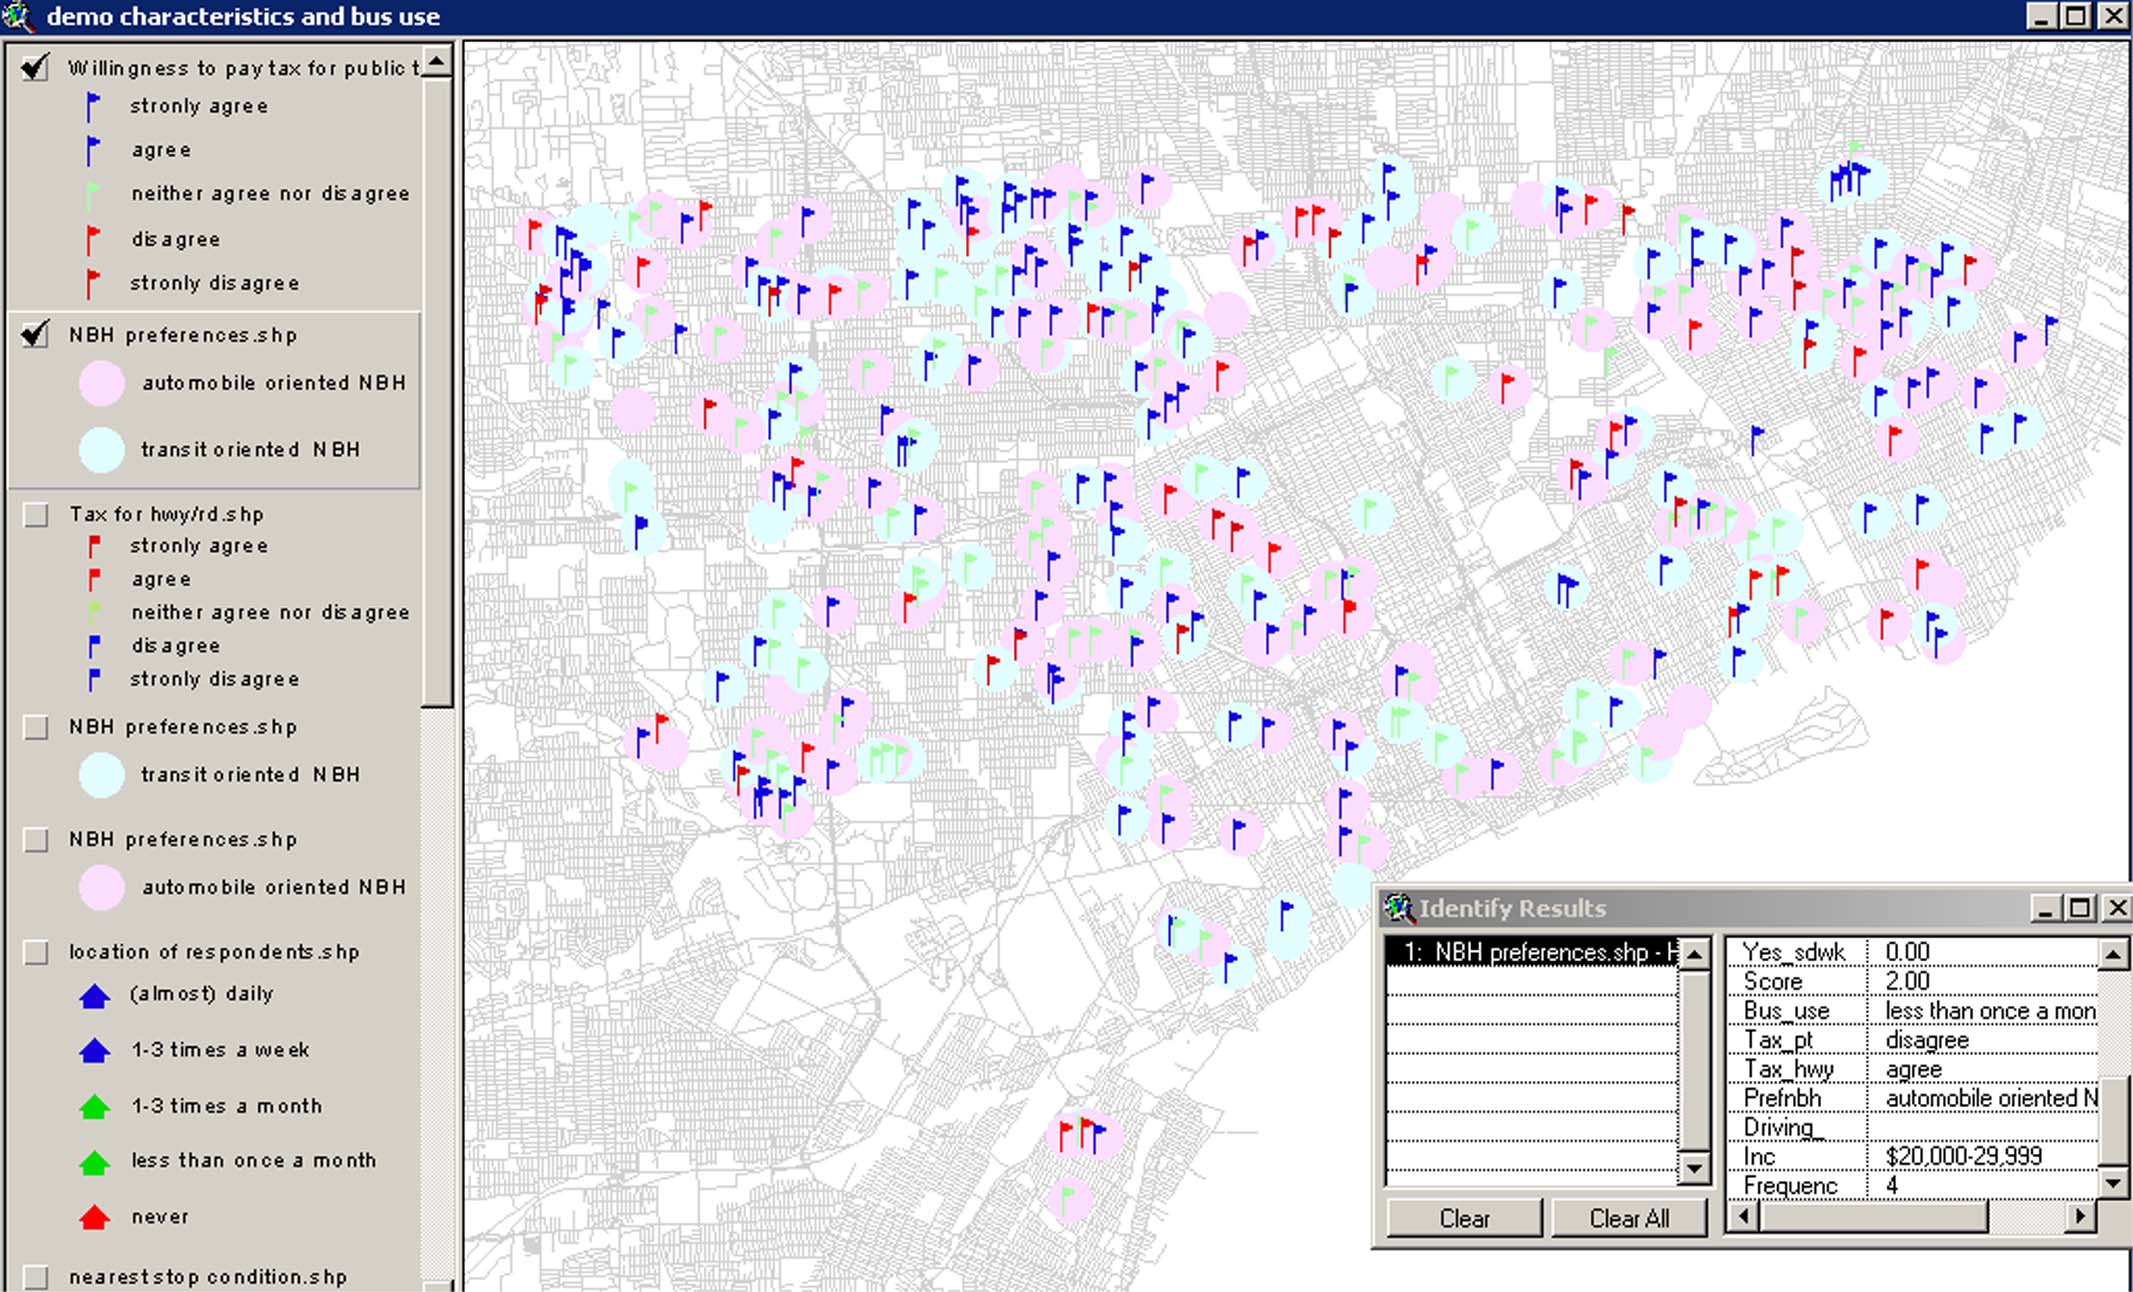
Many respondents who prefer either auto-oriented NBH or transit-oriented NBH agree to pay their taxes for improving public transportation. However, among people who disagree to spend taxes for public transit, most of them prefer auto-oriented NBH. (Number of a red flag in a pink circle are more than that of the red flag in a blue circle.)
IMAP: Characteristics of 380 respondents and bus stops in Detroit
http://www-personal.umich.edu/~wddrake/EunYoung/IMAP9/
<--- Previous page ----- Top ----- Next page --->