Analysis: Points of Interest
- Government Buildings
- Hospitals
- Libraries
- Museums
- Theaters and Convention Centers
- Universities/Colleges
- Find Greater Boston's Points of Interest from the MBTA (Source of Dataset).
After geo-matching dataset for each facility with the street layer, I have tried "Centroid within" method to investigate the locations of each facility; it is turned out that, in average, 68% of facilities was located in subway buffer zones, and it means most points of interest have been well distributed in walking distance from subway platforms. The following animated map shows the distribution of points of interest in Boston area with comparisons between the study areas.
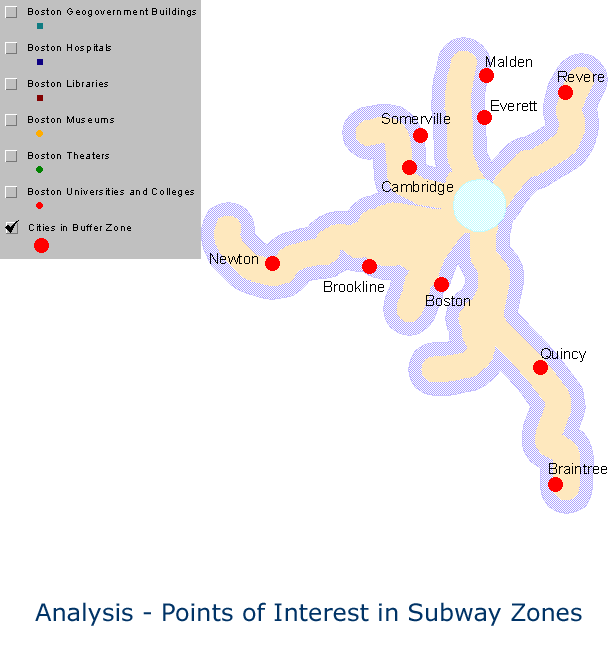
(Click the map to see details.)
Map 17. Points of interest in Boston Area
The next two maps are to be developed as the information system for the downtown crossing. As shown on Map 18, the geographic environment of the downtown crossing, where Charles river and the sea meet, seems to induce the development of the area and allow us to understand why it becomes congested to try to focus subway lines into this small area. I have combined the following two maps and made a clickable information map for the area, in which each point on the map has detailed information about the place retrieved from the dataset using ColdFusion.
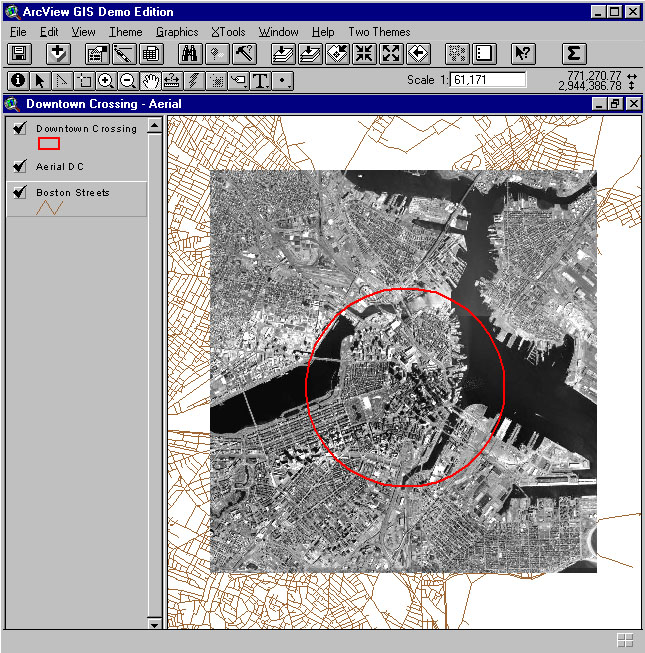
(Click the map to see details.)
Map 18. Aerial Scene of Downtown Crossing
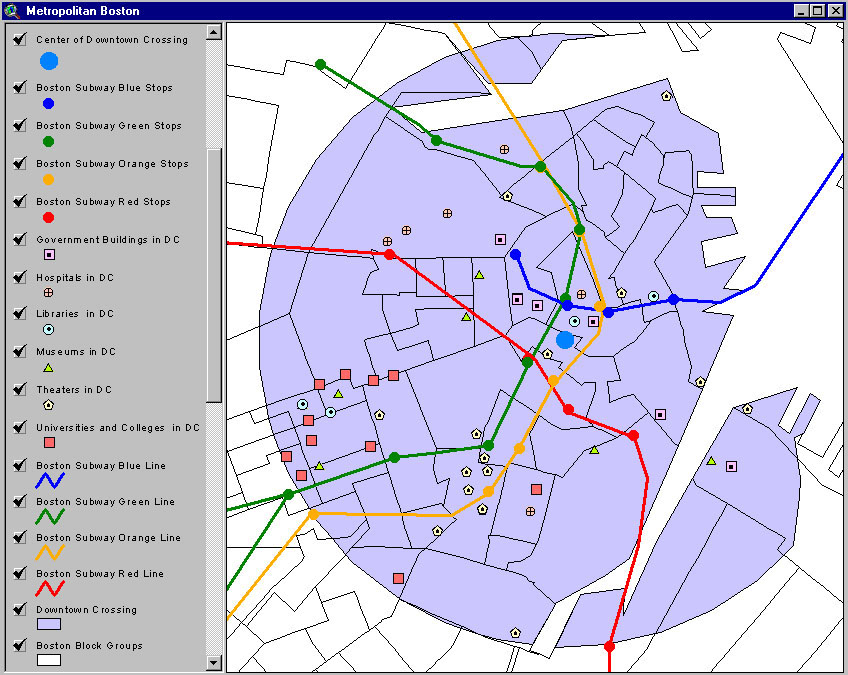
(Click the map to see details or Click here for the clickable information map.)
Map 19. Points of interest in 1-Mile Downtown-Crossing Buffered Zone
The following is an animated map having a few spider maps that present the distribution of facilities based on the center point of the downtown crossing.
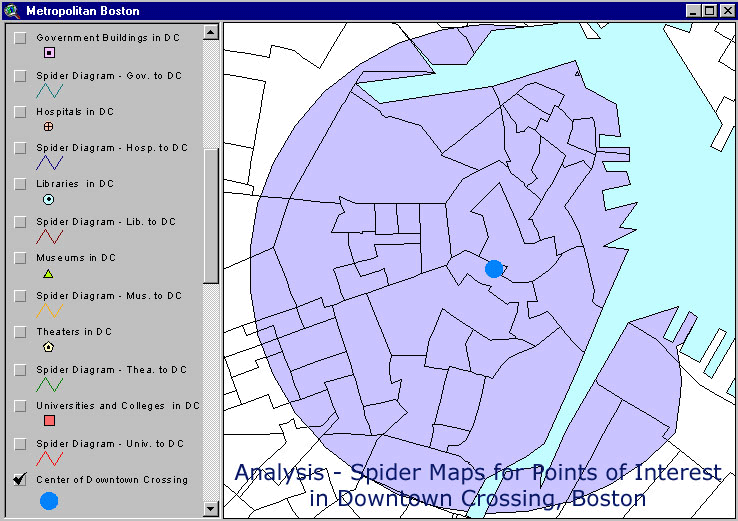
(Click the map to see details.)
Map 20. Distribution of Facilities from the Center of the Downtown Crossing
Each spider map shows how a specific urban facility is distributed and how far it is from the center of downtown crossing. In my own analyses, it turned out that each category of facilities tends to be grouped in a specific region for a specific purpose. For instance, large-scale hospitals have been located at the northwest area, theaters and convention center have made a cultural network at the southwest side, most educational institutes including universities and colleges are shown as a group at the farwest area, and governmental buildings tend to be focused on the central area of the downtown crossing. Libraries and museums, however, seem to be evenly distributed for each different community.
With statistical means, it is proved that these urban facilities are relatively well placed within downtown crossing area. The average walking distance from the center of the area to each facility is 0.54 miles, which is smaller than MBTAs average working distance, 0.75 miles, for both handicapped and non-handicapped citizens.
SUBWAY ZONES IN BOSTON, MASSACHUSETTS / POINTS OF INTEREST