Monday, September 20, 2004
Professor
Sandra Arlinghaus
UP 507 Advanced Geographic Information
Systems (Winter, 2001)
English Home/
UP507
Course Home/ UP835 UTEP Research Seminar/
Resume
Empowerment Zone (Locator
/ Urban EZ/ECs)
Zip
Code Business Patterns
County
Business Patterns
UP 507 Information Systems Course Project
Introduction
This
course project is divided into two sub-projects, each of which constitutes
research on the evaluation of empowerment zone (EZ) policy.
The research evaluates program impacts of six urban empowerment zones on
employment and business establishments. Two
methodological issues will be considered. The first issue is to designate
the control area for each EZ; once established, the control area will be
compared with the EZ in terms of program impacts. The control area
should have socioeconomic characteristics similar to each EZ.
To ensure that it does have appropriate characteristics, the control area
will be developed in geographical space using GIS and factor analysis.
The second project involves the acquisition of annual employment and business
establishment data, for the control areas and for the EZs which do not
have their own statistical data. For simplicity, the Detroit Empowerment
Zone (DEZ) is employed as a case study.
Research Question
What is a good procedure for
measuring similarity and dissimilarity of socioeconomic characteristics
between geographical units such as census tracts?
How can GIS contribute to
managing the values representing socioeconomic characteristics in space
as a tool to find control areas?
Research Scenario
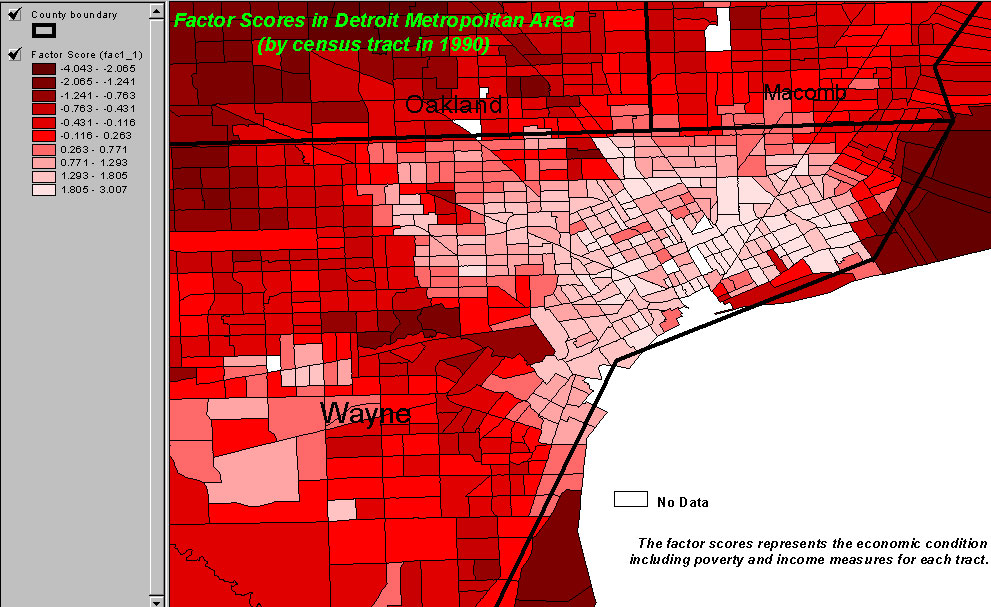
Select variables which represent
socioeconomic characteristics for each census tract in the Detroit Metropolitan
Area. I considered 25 variables.
Execute factor
analysis to get factor scores for each census tract. From the
factor analysis, reduce the number of variables to several factors, each
of which represents some socioeconomic characteristics such as income or
poverty. Compute factor scores for each census tract. I extracted
three
types of factor scores for each census tract.
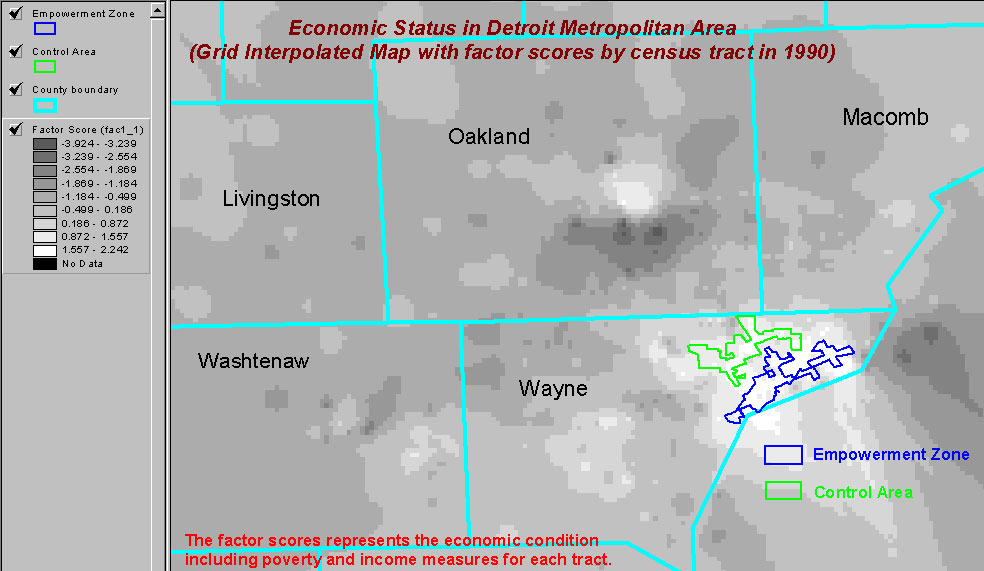
Draw
a thematic map of the Detroit Metropolitan Area with factor scores by census
tract.
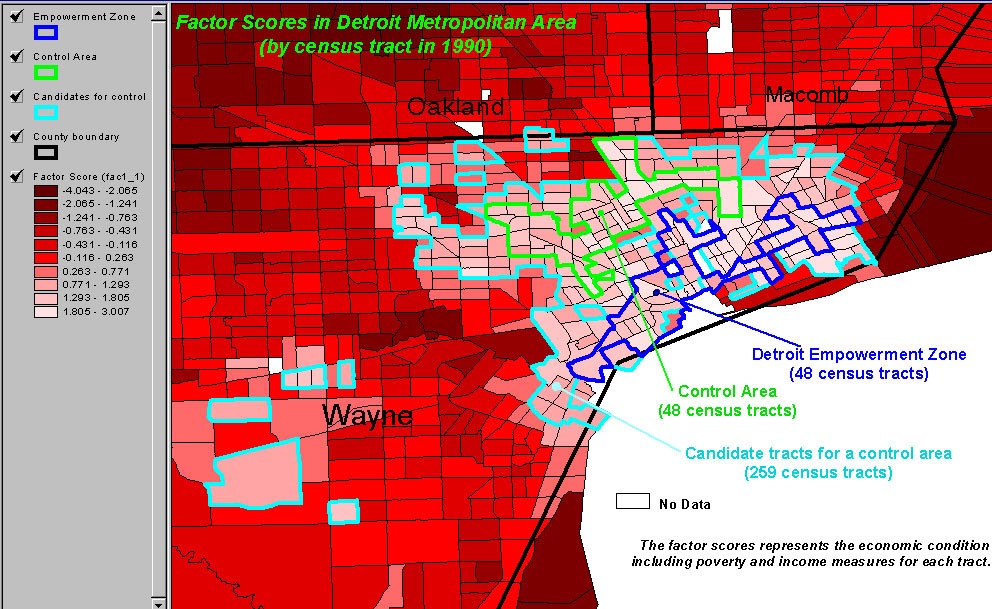
Designate
a control area that falls into the same class as the DEZ.
Pursue
a statistical hypothesis
test to verify whether or not the experimental area (DEZ) and the control
area are the same in terms of the socioeconomic characteristics that are
represented by factor scores.Iterate
the process from the thematic map stage until getting a suitable control
area.
Method (using Detroit Empowerment Zone)
Research Question
Suppose two areal units with
different boundaries in geographical space; one is the area that does not
have necessary data, and the other is the area that has the data.
Let us call the former the target zone and the latter the source zone.
In the case that the source
zone area contains the target zone area, can we get the data for the target
zone from the source zone using GIS?
Research Scenario
Data
needed
We need annual employment
and business establishment data by census tract of Detroit Empowerment
Zone (DEZ).
Identification
of a target zone
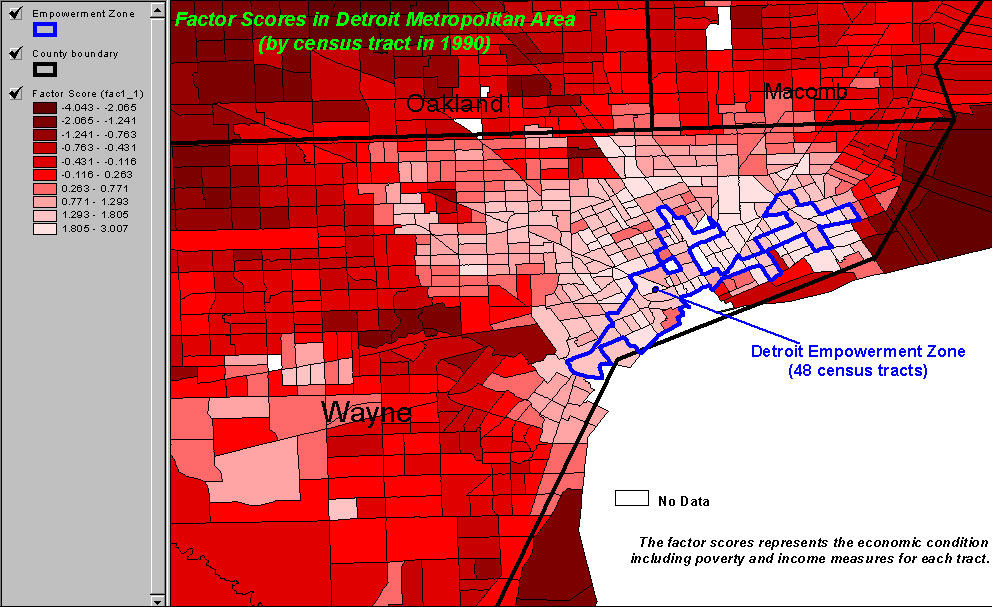
DEZ is made up of 48 census
tracts, but the tracts do not have annual employment and establishment
data.
Identification
of a source zone
The areal interpolation method
using GIS can provide us with these statistical data by overlaying the
DEZ map on the zip code boundary map with the data.
Method
General
Information
Location of DEZ (Map 1)
DEZ is made up of 48 census
tracts, which do not have annual employment and establishment data (Map
2). Let us call DEZ the target zone which means that it does not
have needed data.
The zip code map containing
DEZ with annual employment and establishment data by zip code is made up
of 17 zip code areas (Map 3). Let us call it the source zone which
means that it has needed data.
Process
of Areal Interpolation
(STEP I
: Digitizing)
Superimpose the target zone
map (DEZ map) on the source zone map (Zip code map) (Map 3).
Split the source zone layer
by the census tract lines of the target zone (Map 4). 110 polygons
with the annual employment and establishment data were made (Map 5).
Note that there is no unique key field in the attribute table. Without
a unique key field, we cannot perform a spatial join to create a new attribute
table by linking attribute tables of multiple layers. For the spatial
join, each attribute table of the layers should have a common unique key
field.
(STEP II
: Union)
Superimpose the target zone
map (DEZ map) on the source zone map split by DEZ census tract lines with
110 polygons (Map 6).
Execute union of the polygons
into DEZ census tract. Then, we can get a map with 48 polygons which
are exactly consistent with DEZ (Map 7). Note that the attribute
table has annual employment and establishment data, but still does not
have a unique key field.
(STEP III
: Linking the polygons to data tables)
What we need is a data table
with both annual employment/establishment and socioeconomic data by census
tract.
First, link the table with
socioeconomic data by census tract (Table 1) to the DEZ map by census tract
(Map 2). Then, we can get the DEZ map with socioeconomic data by
census tract (Map 8)
Second, we want to perform a
spatial join of Map 8 to Map 7 to create a new census tract layer with
both socioeconomic data in Map 8 and employment data in Map 7.
However, the maps do not have a common key field to join with. For
this, create a key field named ID in the attribute table of Map 7
(Map 9). Seek POLID, which means Polygon ID, of each polygon in Map
8 to make a data table (Table 2) which matches ID's in Map 9 with POLID's
in Map 8 (Map 10). Join Table 2 to the attribute table of Map 7 with
ID field as common key field to create the map which has the employment
and establishment data table with POLID field as unique key field (Map
11).
Finally, join Map 11 to
Map 8 with POLID field. Then, we can get the DEZ map (Map 12) with
its attribute table containing both employment/establishment and socioeconomic
data by census tract (Table 3).
| General Information |
Map 1 |
Location of Detroit Employment |
| Map 2 |
Detroit Empowerment Zone by 1990 Census Tract (With POLID) |
| Map 3 |
Zip Code Area Containing DEZ |
| Table 1 |
Socioeconomic Data by 1990 Census Tract in DEZ |
| STEP I:
Digitizing |
Map 4 |
Split Zip Code Layer by DEZ Census Tract Lines |
| Map 5 |
Zip Code Map After Split by DEZ Census Tract Lines |
| STEP II:
Union |
Map 6 |
Union of Split Polygons by DEZ Census Tract (Before Union:
110 polygons) |
| Map 7 |
Union of Split Polygons by DEZ Census Tract (After Union:
48 polygons with employment data consistent with DEZ) |
| STEP III: Linking Polygons to Data Tables |
| Map 8 |
Detroit Empowerment Zone by 1990 Census Tract (With POLID
and socioeconomic data) |
| Map 9 |
Detroit Empowerment Zone by 1990 Census Tract (With a new
ID field and employment data) |
| Map 10 |
|
| Table 2 |
|
| Map 11 |
Detroit Empowerment Zone by 1990 Census Tract (With POLID
and employment data) |
| Map 12 |
Detroit Empowerment Zone by 1990 Census Tract (With employment
and socioeconomic data) |
| Table 3 |
Employment/Establishment and Socioeconomic Conditions by
1990 Census Tract in Detroit Empowerment Zone |
Assumption
Areal interpolation is based
on the assumption that employment and business establishment are evenly
distributed throughout every zip code area. This assumption, resulting
in probable inaccuracy in the actual number of employment/establishments,
functions as a limitation in collecting data using the areal interpolation
method when we use the actual numbers for a study.
However, this assumption can
be tolerable if the data are used for comparing changes over time in an
area since we can assume that the annual % change of employment/establishment
in a same area over time is not different.