 IMAGE CLASSIFICATION
IMAGE CLASSIFICATION
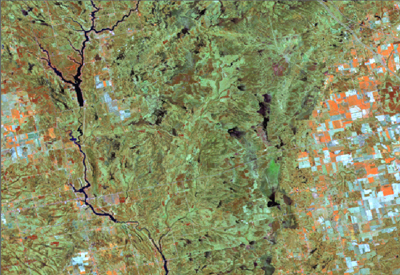
Once the image had been registered to a coordinate space the next phase of analysis could be performed. We could then overlay the GPS collected field points that located our various aspen stands. The image at the right shows the aspen stand location area and the image below shows the overlaying of the most valuable GPS point (the point with the aspens at the age we are most concerned with) along with the selection of the primary area of interest (AOI). It is from this AOI that the collection of signatures making up the desired aspens was derived. Once the signature had been identified, a supervised classification of the imagery was performed. The resultant classification should have identified aspen contributed forests, that is, forest stands that are mostly composed of aspens.
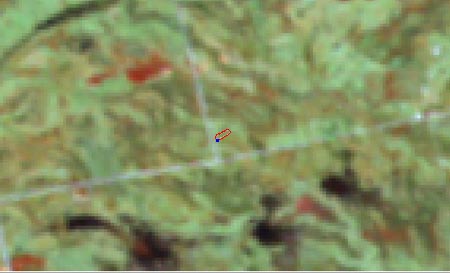 The AOI is
outlined in red. The approximate dimensions of the stand were determined in the
field and the lower left starting point was marked by the GPS point, shown in blue.
Click on the GPS point to see the associated location and aspen stand.
The AOI is
outlined in red. The approximate dimensions of the stand were determined in the
field and the lower left starting point was marked by the GPS point, shown in blue.
Click on the GPS point to see the associated location and aspen stand.
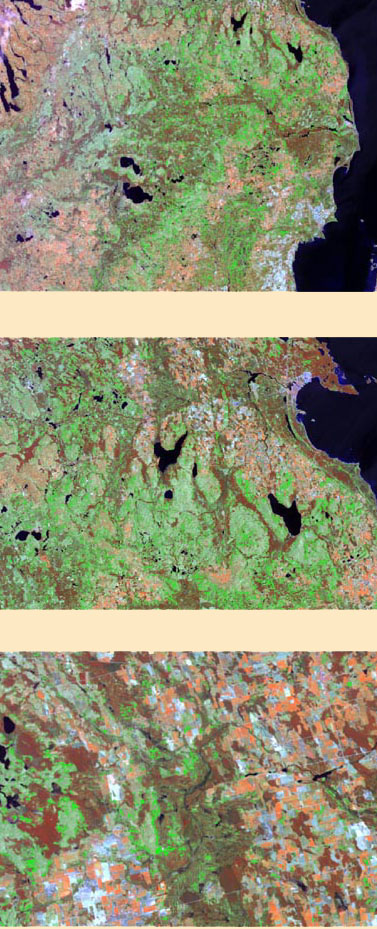 These images depict portions of
the classified imagery. The aspen layer (bright green) is displayed on top of the
original image. Each image shows a greater zoom scale and starts to show how the
aspen groups are broken out amongst the other land covers.
These images depict portions of
the classified imagery. The aspen layer (bright green) is displayed on top of the
original image. Each image shows a greater zoom scale and starts to show how the
aspen groups are broken out amongst the other land covers.
The final steps in the aspen classification used procedures called 'clump' and 'sieve'. These are two commands found within Imagine that allow for the various aspen polygons to be clumped together and to sieve out any polygons that represent less than five acres. The image classification is now ready to be integrated with the GIS data.