GIS and IMAGE DATA INTEGRATION
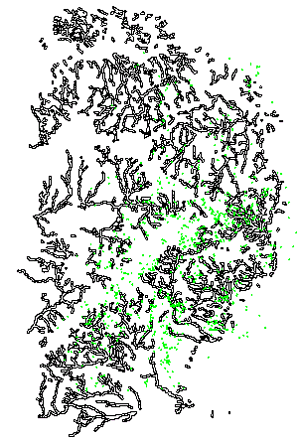
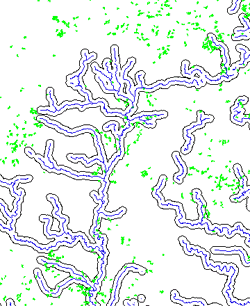
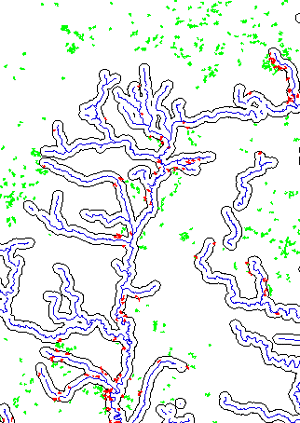
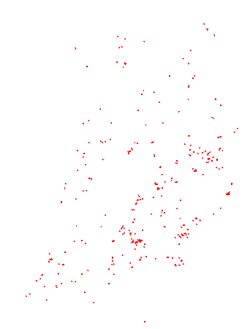
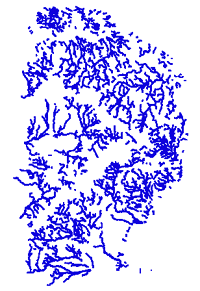
The final products from the image analysis and the GIS manipulations were various Arcview GIS shapefiles (Arcview's data format). Once this data was gathered, the initial question of identifying potential Ruffed Grouse habitat (i.e. aspen stands) could be answered. The next and final analytical step was to overlay the located aspen stands with the proximity buffer created around the rivers layer. This allowed for the selection of those aspen stands that intersect the river buffer and are therefore within 1500 feet of water. This final analysis produced the end product of all aspen contributed forest stands that are larger than five acres and are within 1500 feet of a flowing water body. The series of pictures below shows the two final data layers (aspen classification and the rivers buffer), the overlaying process, and the resultant aspen stands. Hold the cursor over any of the images to see what they represent.