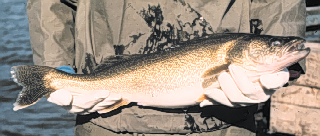

The co-existence of brown trout and walleye is uncommon. The brown trout, originally from Eurasia was stocked into the Michigan streams such as the Sable River in the late 1800's and early 1900's. Stocking continues today. In its pre-dam days, the Au Sable River would have been too cold to support walleye. The impoundments which result from Consumer Powers' dams allow the water to warm sufficietly to support walleye.
The extent to which these species overlap is unknown. One hypothesis for the lack of juvenile recruitment in brown trout populations between Mio Dam and Alcona Dam pond is that walleye prey on small brown trout. It may also be the case that where adults of the two species co-occur, competition for resting places and forage fish may result.
Walleye and brown trout
do have different habitat preferences, particularly in relationship to
temperature and flow. I used US Fish and Wildlife Service Habitat
Suitability Curves for velocity to compare adult and fry brown trout and
walleye habitat tolerances.
I used a river modeling system (River Analysis System) to predict water velocities in several cross sections at different flows. RAS allows one to stratify the cross section into a chosen number of "slices" and create a map of velocity distribution in the cross section. I did this, then took the resulting images into ArcView (via Adobe Photoshop to convert them to .jpg files). In Arcview, I used on-screen digitizing to re-map the velocity distributions. Then, using data generated in RAS, I determined the exact velocity of each slice. Using the US Fish and Wildlife Service's Habitat Suitability Indices (Velocity Curves) for walleye and brown trout, I assigned a habitat score to each slice--where "1" was most optimal and "0" was least optimal. I used those scores to shade the cross sections. Look at the animated cross sections below to see the result! The cross sections you are viewing are in pairs. In each pair, the adult brown trout habitat distribution comes first, followed by walleye habitat distribution at the same cross section. The next pair repeats the process at another cross section or another flow. I modeled two flows, 1 cubic meter per second (cms)--to represent low flows, and 10 cms to represent high flows. Darker blue-green areas represent better habitat, pale blue to white areas are poor habitat. Brown trout are stronger swimmers than walleye and therefore better suited to areas of moderate to high flows.
Above is a RAS output
(the colorful image) of velocity distributions in a channel cross-section.
The velocity/area distribution chart and the optimal habitat table
are analyses I performed using Microsoft Excel. This steep channel
bottom shape coupled with high flows create an area of poor habitat or
brown trout and walleye at all life stages. Below is the animated
habitat version of this and other cross sections.
In the Au Sable River, walleye travel from the Alcona Dam Pond up stream some thirty kilometers to the Mio Dam tailwaters to spawn. Many stay in the area between McKinley Bridge and the tailwaters all summer. Brown trout also frequent that stretch of the river. However, there is little use of the river between McKinley Bridge and the Alcona Dam Pond backwaters by walleye or brown trout. It is not exactly clear what factors are contributing to this habitat selection by both species, be it thermal, in-stream cover, flow velocities related to a change in gradient, or some variation in the forage base. Below is a *hypothetical* distribution of walleye and brown trout in the Au Sable River. The image was created in ArcView, using on-screen digitizing to create a "theme" for each fish. The green dots represent walleye; the red dots represent brown trout. Each dot represents 0.20 fish. Notice the opportunity for habitat overlap nearest Mio.