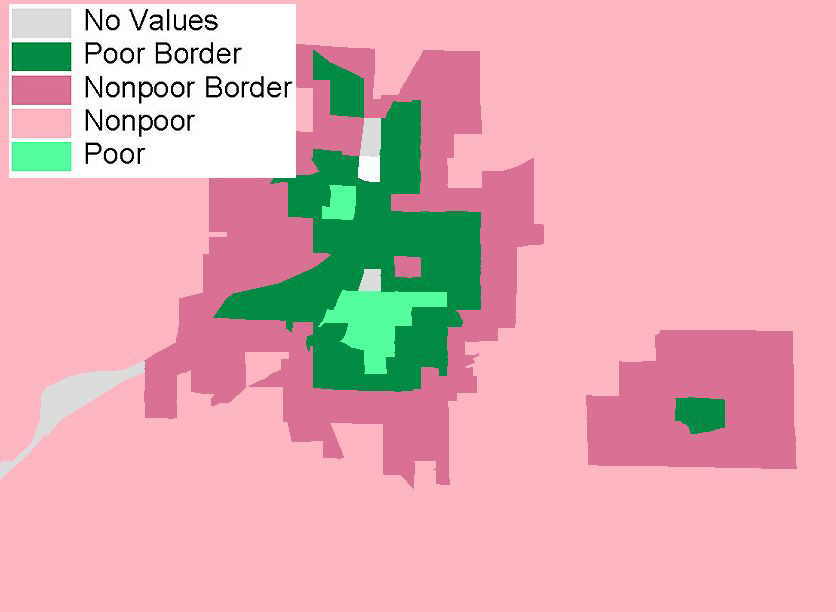
The map is based on 1990 Census Block Groups and is projected in Michigan State Plane - South.
- Poor: any block group with greater than 25% poverty
- Nonpoor: any block group with less than or equal to 25% white population
- Nonpoor border: any nonpoor block group that bordered a poor block group
- Poor border: any poor block group that bordered a nonpoor block group
- No values: a few of the block groups represents rivers, parks, or other unpopulated areas
Kent County, MI
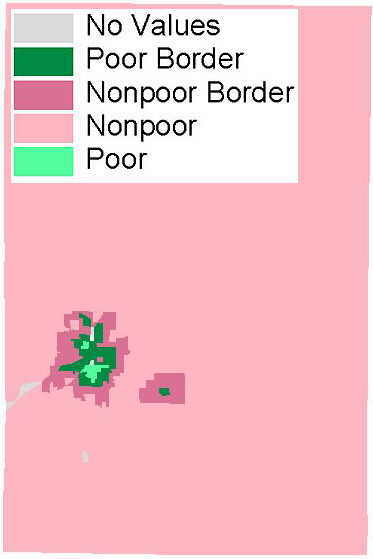
Zoom In