Analysis:
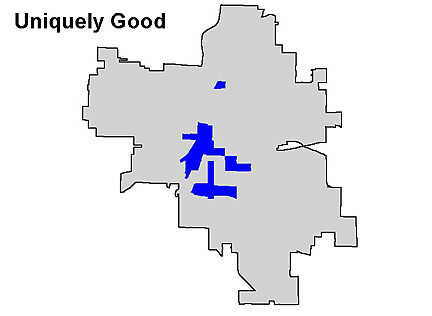
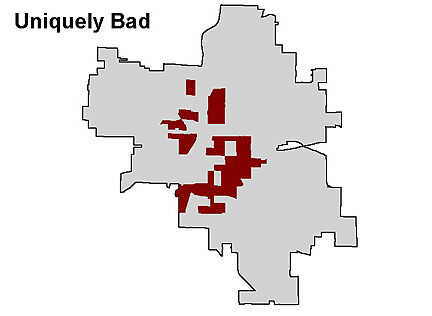
One overall goal of all this research is to identify areas where community development strategies may work. One theory of community development looks at the needs of a community and another theory looks at a community's assets.
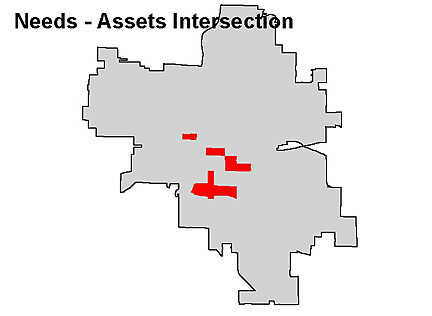
An alternative theory looks for areas that have high needs and high assets and then targets those areas for change. GIS makes such analysis possible.
 |
 |
 |
- 73% minority
- 67% African American
- 6% Hispanic
- Median age = 26
- 51% Female headed households
- Average household income = 21,202
- 49% poor
- 24% very poor
- Median year of house = 1939
- Average house value = 40,109
- Neglect density = 2
- Delinquency density = 9 (one block group =37)
- Total churches = 28
- Total schools = 8