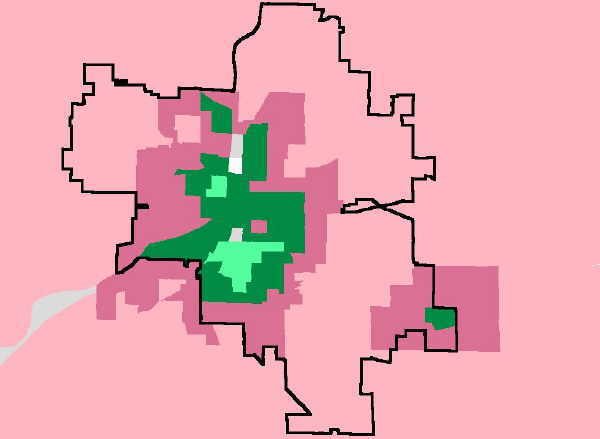
| Clustering: | Although only two variables were mapped, the spatial auto correlation maps show that there is a disadvantaged population centered around the city of Grand Rapids. Moreover, the transition zones between attributes occur at the same location. The map below shows the outline of Grand Rapids and East Grand Rapids surrounding the poverty data. The area of interest mostly falls within the city borders. |
|
|
| It is no surprise that there are concentrations of poverty and minority communities in Grand Rapids. But, being able to visually see this phenomena helps in understanding county patterns and can directly lead to the next steps for analysis. | |