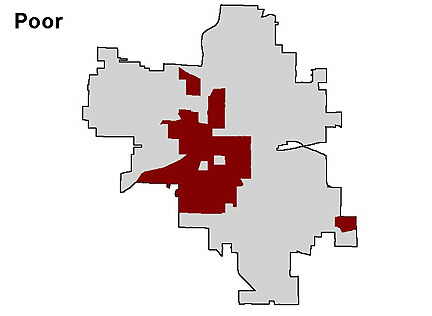
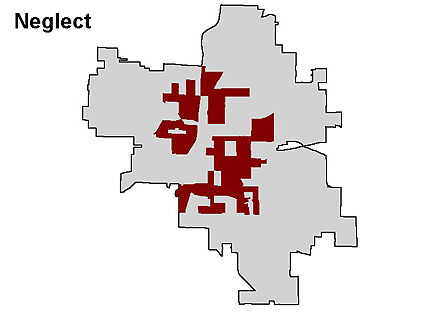
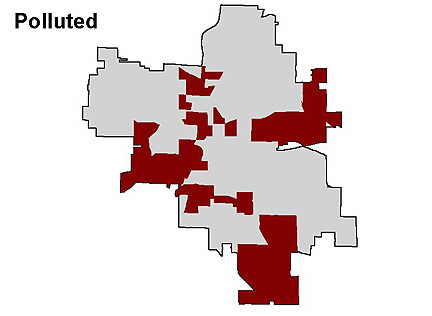
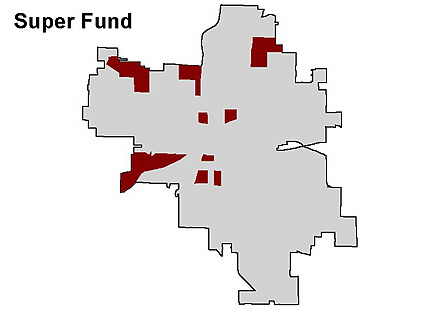
- Dark Red = negative traits
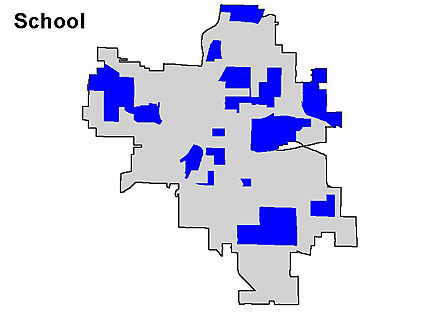
- Blue = positive traits
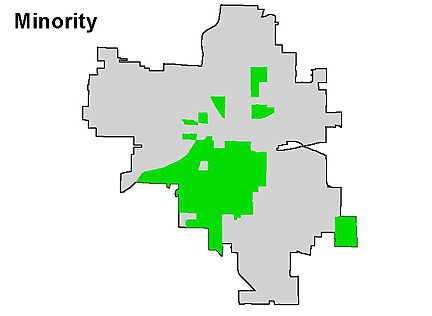
- Green = nuetral traits
Polygons: 168
Note: Block groups formed the base unit for analysis. All other layers were manipulated to work with block groups.
Polygons: 52
Note: polygons with > 25% non-white
Image
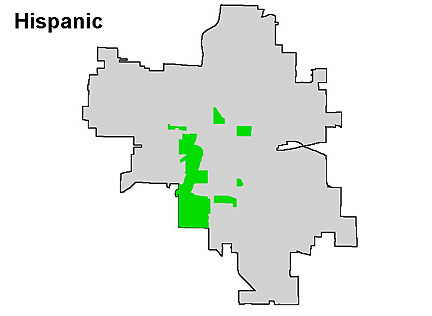
Polygons: 17
Note: polygons with >10% hispanic
Image
Polygons: 53
Note: polygons with > 25% poor
Image
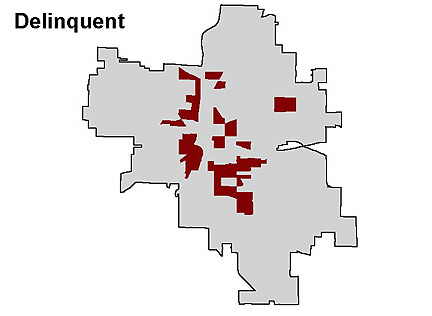
Density:
Polygons: 28
Note: polygons with [delinquent cases/(10-17 year olds)] > 5%
Image
Density:
Polygons: 51
Note: polygons with [neglect cases/(0-13 year olds)] > .8%
Image
- TRI: data on annual estimated releases of over 300 toxic chemicals to air, water, and land by the manufacturing industry. Industrial facilities provide the information
- PCS: wastewater discharge from industries and municipal treatment plants
- BRS: treatment, storage and disposal (TSD) facilities and major generators of hazardous waste
Note: polygons with at least 1 toxic facility
Image
Polygons: 10
Note: polygons with at least 1 toxic facility
Image
Polygons: 23
Note: polygons with at least 2 schools in it
Image
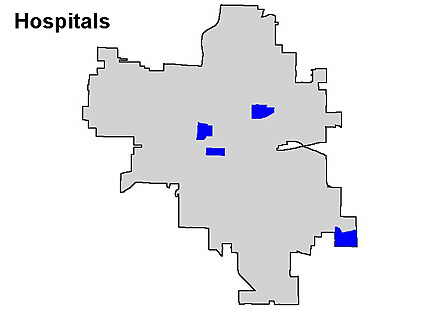
Polygons: 4
Note: polygons with at least 1 hospital in it
Image
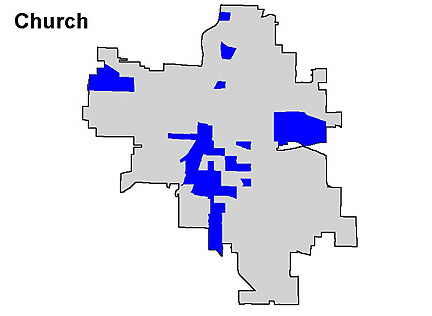
Density
Polygons: 26
Note: polygons with < 500 people/church [total population/# of churches]
Image
Density:
Polygons: 47
Note: polygons with <500 people/united way agency [total population/# of United Way sites]
Image