The relationship between land use and water quality is
an area of research in environmental science. Urbanization and agriculture
can have adverse effects on water quality by interrupting the hydrologic
cycle and contributing pollutants to stormwater runoff. These may
include fertilizers, persticides, soil erosion, road salt, grease and oil,
feedlot runoff, and human sewage overflow. Forests and wetlands have positive
effects on water quality because they permit rainwater to percolate slowly
through the ground, naturally purifying and removing pollutants, reducing
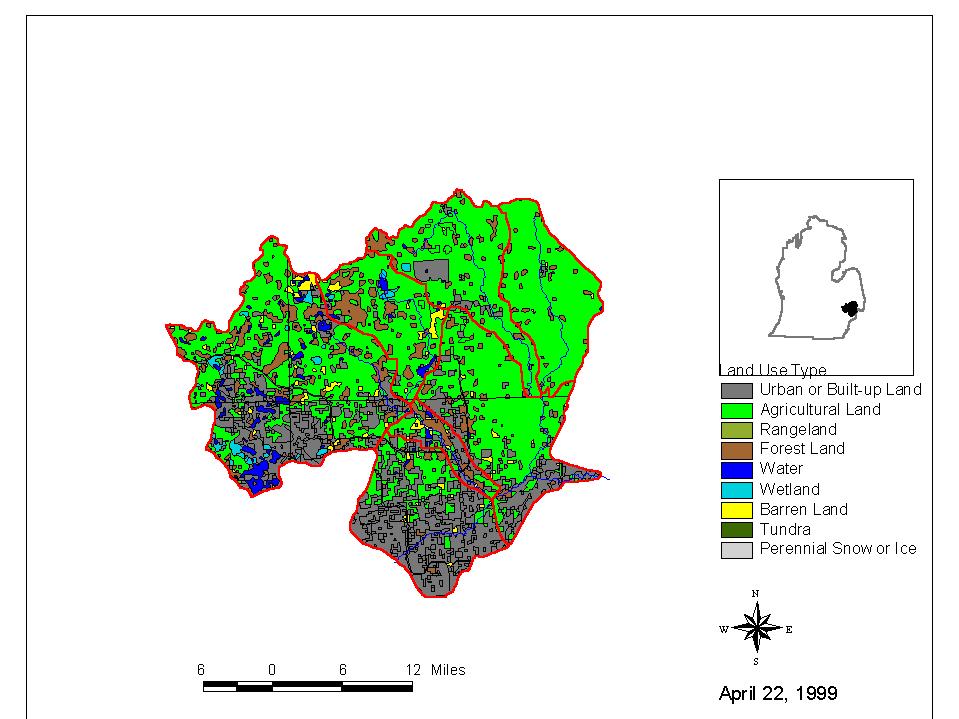
flooding and nonpoint source runoff. This page presents some maps
produced in a GIS (geographic information system). These maps compare
the land use within in each subwatershed and compare bacteria trends within
each watershed. An analysis of the relationship between bacterial
water quality and land use in the watershed is presented.
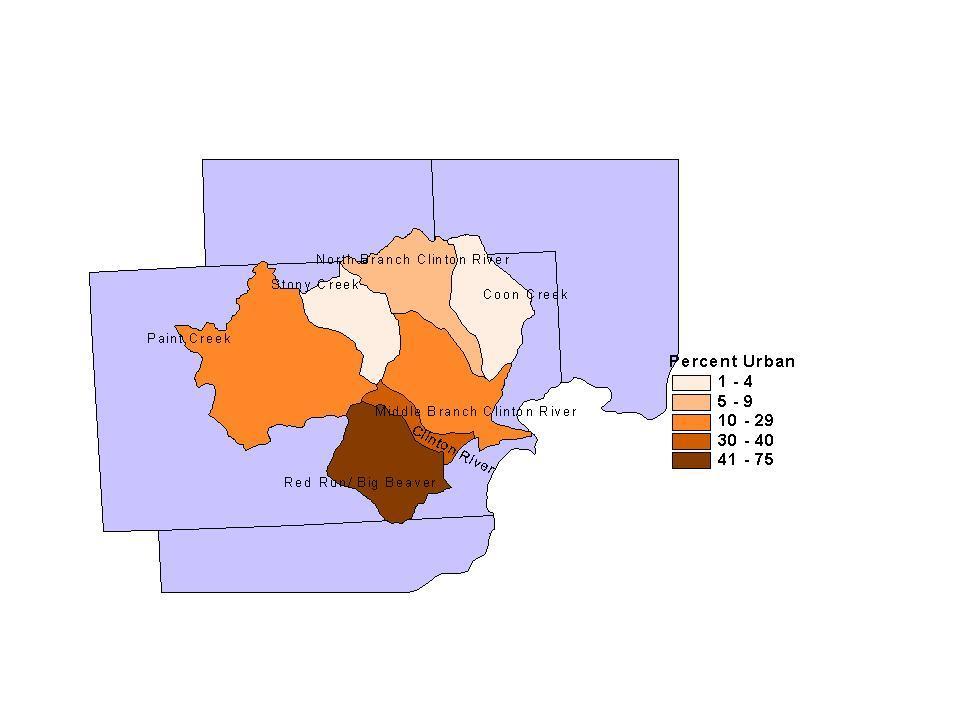
The most urbanized subwatershed is the Red Run Drainage. As you will see later in the page, this is also the sub-watershed with the worst bacterial water quality problems.
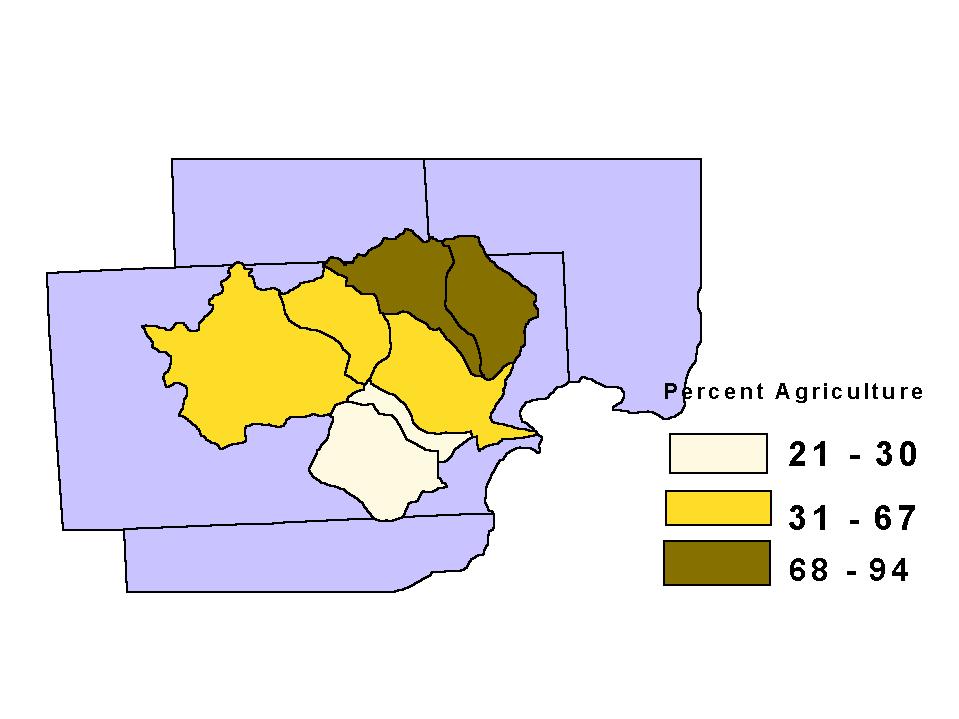
The greatest amount of agriculture is located in the North Branch Clinton and Coon Creek sub-watersheds. These sub-watersheds have among the best in terms of bacterial water quality. Farmland, however, is rapidly being converted to large housing sub-divisions in these areas.
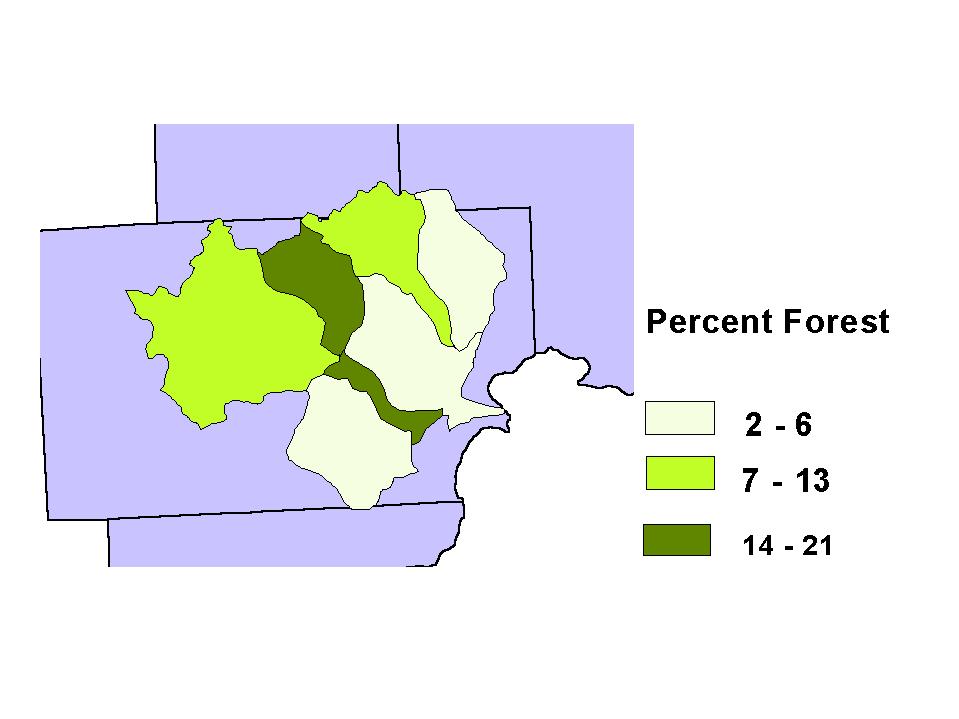
The greatest amount of forest cover is located in the Stony Creek and Main Branch Clinton sub-watersheds.
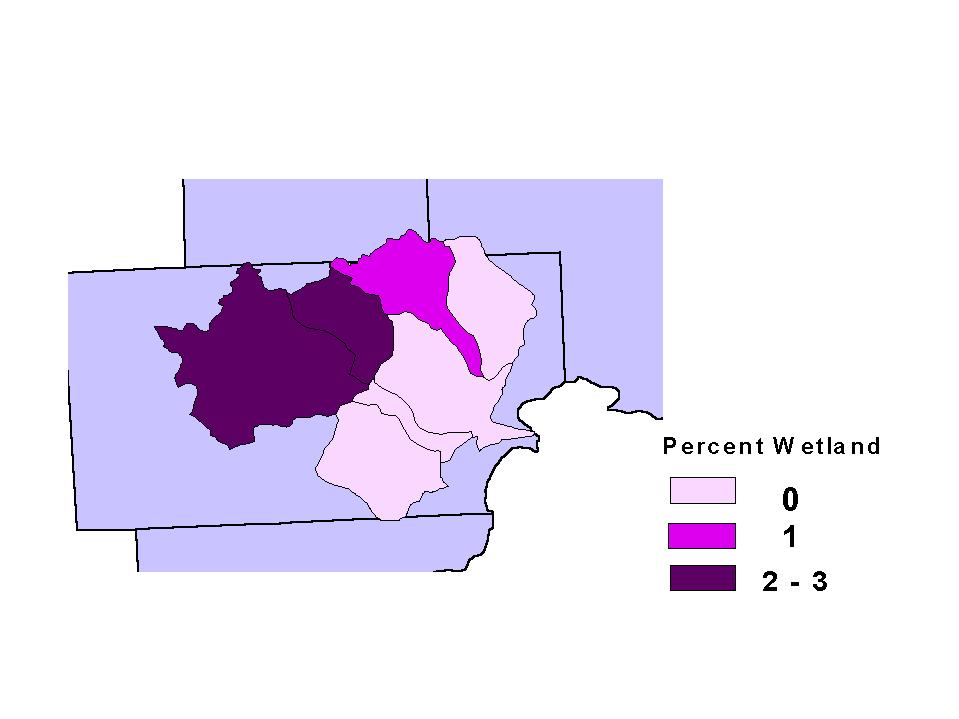
There are, in general, very little wetlands left in the Clinton River Watershed. The greatest proportion (2-3% of the total) are located in the Stony and Paint Creek sub-watersheds.
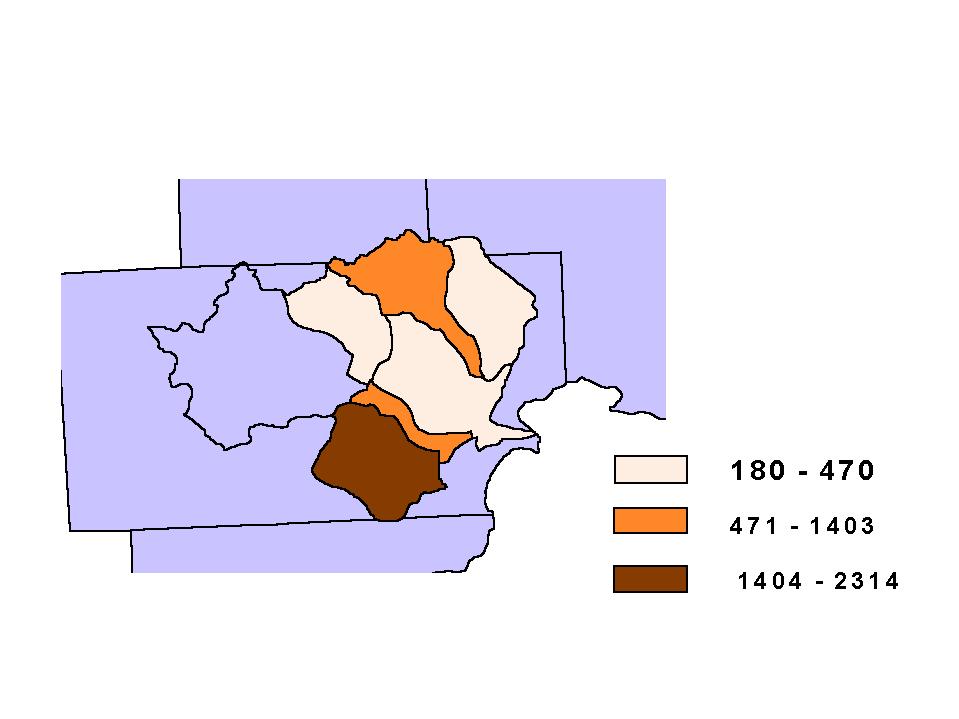
The following maps display the average bacteria of all sampling points
in each subwatershed monitored by MCHD. Bacteria counts are in units
of CFU/mL (coliform forming units per mL water). In general, the
worst problems are located in the Red Run Drainage. No data is available
for the Paint Creek sub-watershed located in Oakland County, as MCHD does
not monitor there.
Average June Bacteria Levels, 1998
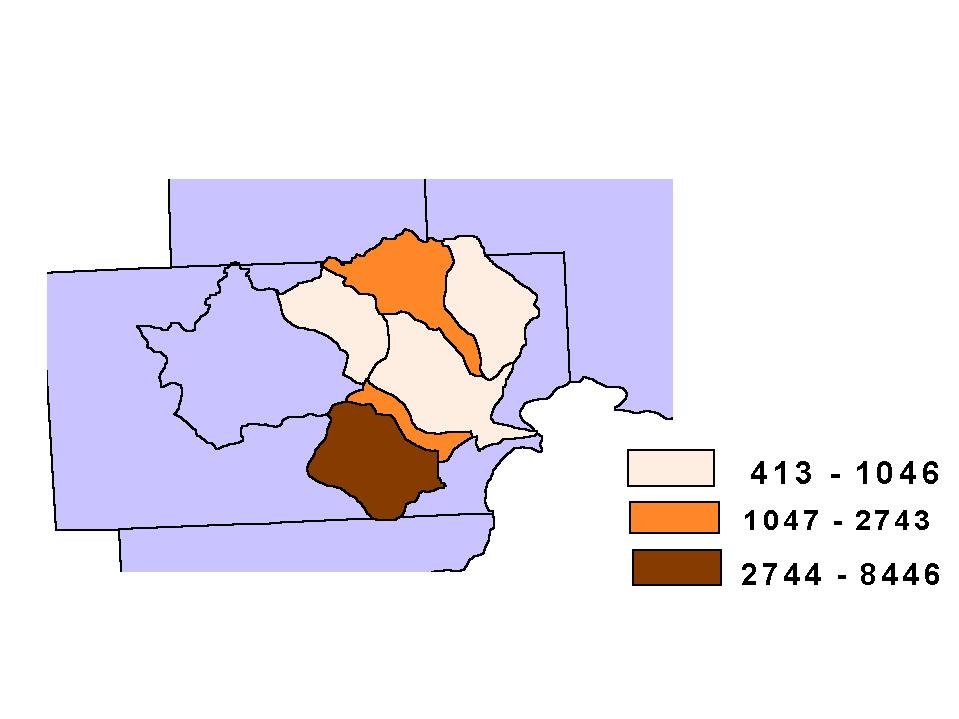
Average August Bacteria Levels, 1998
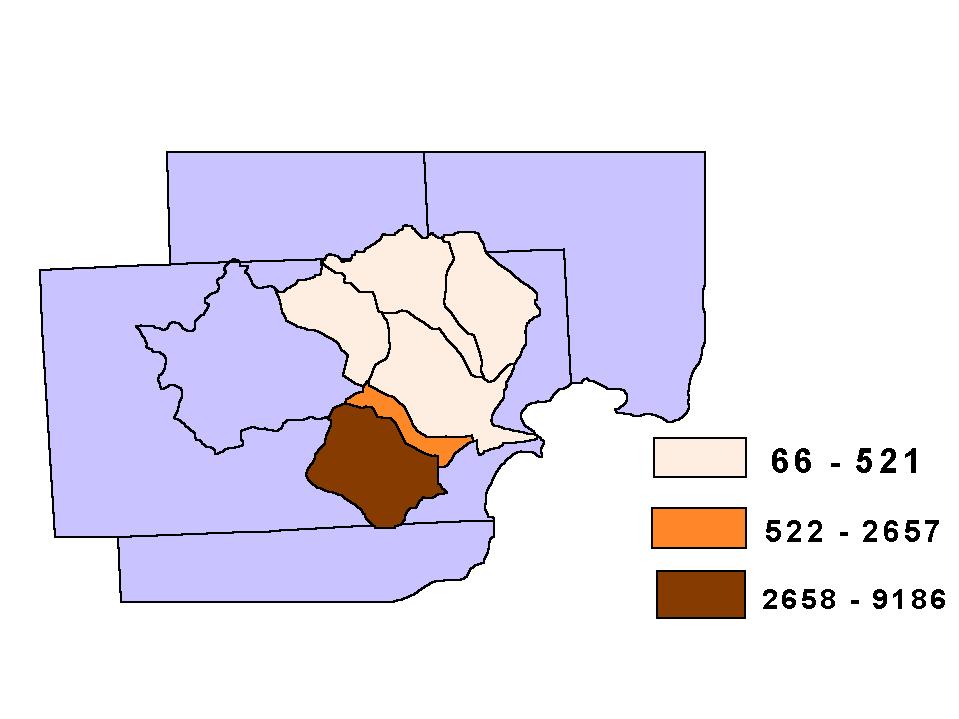
Average October Bacteria Levels, 1998
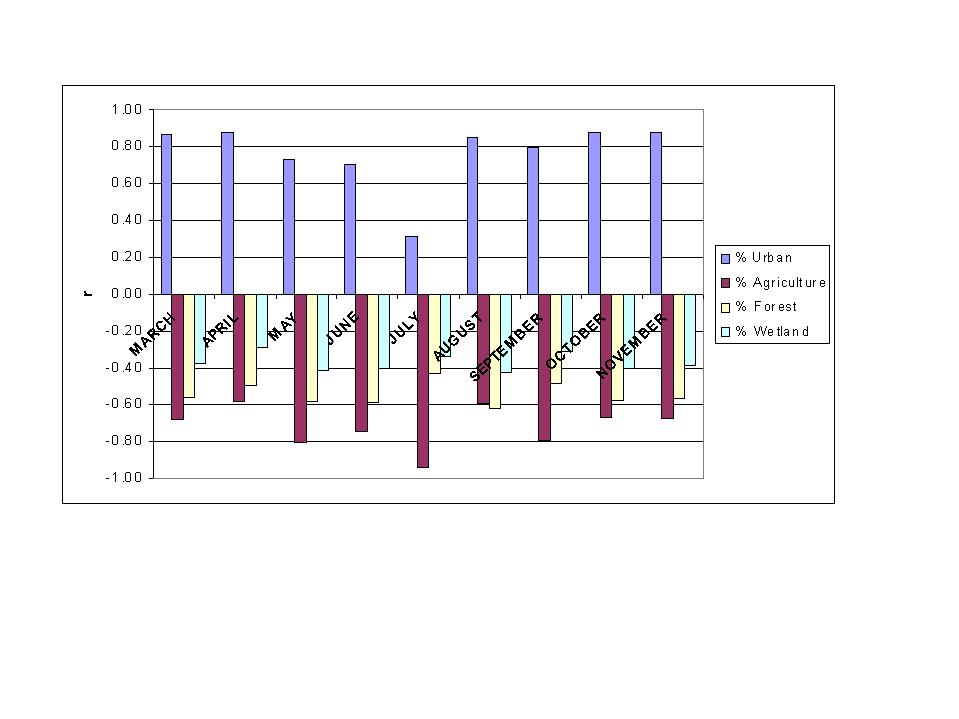
The following graph examines the relationship between land use and average monthly bacteria levels using a very simple statistical analysis tool, called correlation analysis. Correlation analysis gives a measure of how closely two things are related. A correlation coefficient (r) gives a numerical measure of this relationship. An r value of 1 means two things are very closely, positively associated. For example, the more birthdays you have, the more birthday candles you get on your birthday cake. This is a strong, positive association, and would have an r value of 1.0. An r value of -1 means two things are very closely, negatively associated. For example, the more bites of cereal you eat, the less cereal is in your bowl. This is a strong, negative association, and would have an r value of -1.0. Two things that have no relationship to each other, like the amount of rainfall each day and the amount of gas in your car, will have an r-value of 0.
The correlation analysis of the monthly average bacteria and land use data revealed that monthly average bacteria levels have a strong, positive relationship with the percentage of urban land in a subwatershed, and are negatively associated with the percentage of all other land use categories. According to this analysis, urbanization is the strongest positive correlate of the bacterial water quality in the Clinton River Watershed.
These maps were made using ArcView 3.1 software by ESRI (Environmental
Systems Research Institute) and BASINS 2.0 (Better Assessment Science In
Nonpoint Source Pollution) by USEPA
Land Use Data is provided by USGS.