What do you see? 
     
  • Slide1: The light green area is the sewer zone before 1985.
  • Slide2: The dotted yellow polygons are the low-density residential land use before 1985.
  • Slide3: The dark green area is the new sewer zone between 1985 and 1995.
  • Slide4: The yellow polygons are the low-density residential land use between 1985 and 1995.
  • Slide5: The dotted dark green area is the potential hook-up zone to the new sewer zone between 1985 to 1995.


    What do you see? 
     
  • Slide1: The light green area is the sewer zone before 1985.
  • Slide2: The dotted yellow polygons are the low-density residential land use before 1985.
  • Slide3: The dark green area is the new sewer zone between 1985 and 1995.
  • Slide4: The yellow polygons are the new low-density residential land use between 1985 and 1995.
  • Slide5: The dotted dark green area is the potential hook-up zone to the new sewer zone between 1985 to 1995.


    Conclusion: 
     
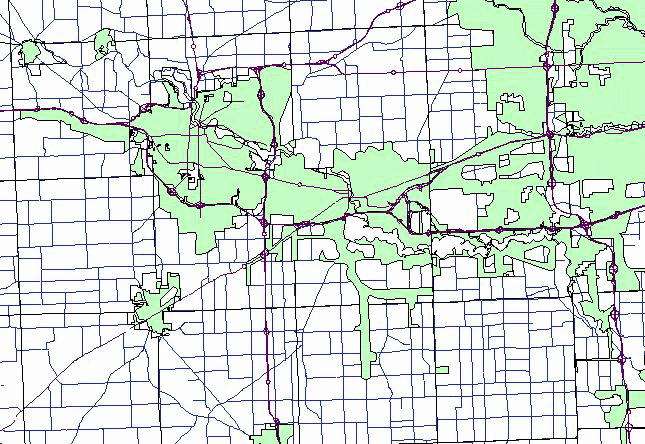
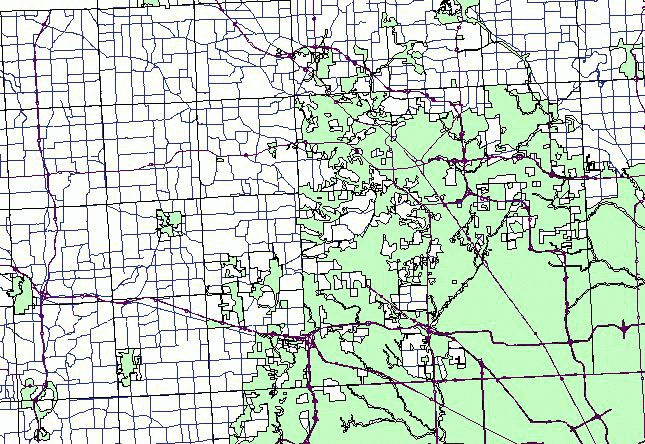
  • The leapfrogged larger low-density residential developments before 1985 dictated where new sewer zone between 1985 and 1995 was located. Then, larger new low-density residential developments between 1985 and 1995 fully take advantage of the new sewer zones. However, smaller patches of low-density residential land use either before 1985 or between 1985 and 1995 were located far out of the hook-up distance of the sewer zone before 1985 or even the new sewer zone between 1985 and 1995.