Though see the following animated GIF of the figure eight.
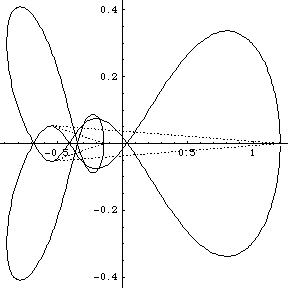
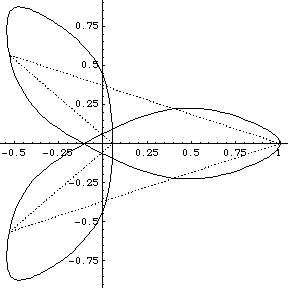
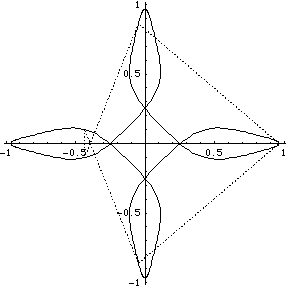
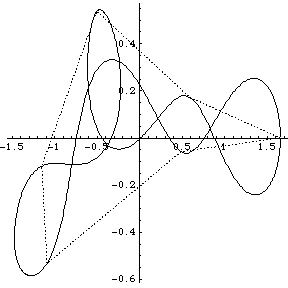
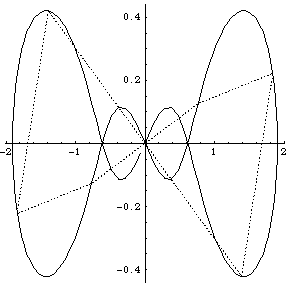
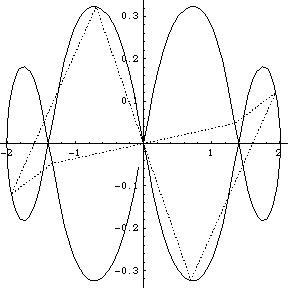
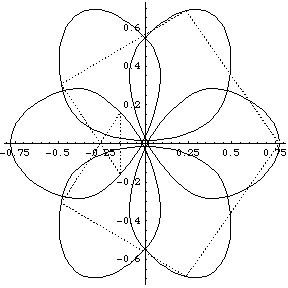

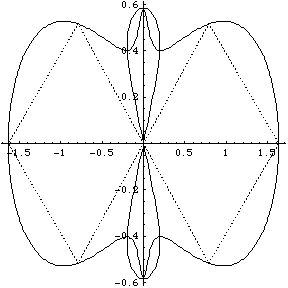
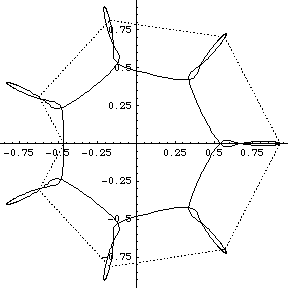
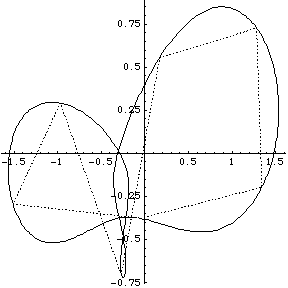
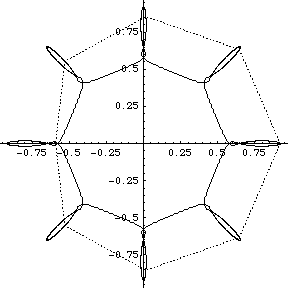
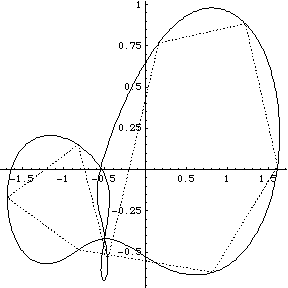

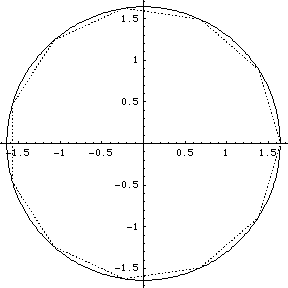
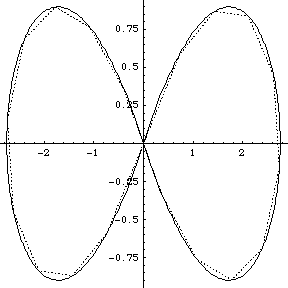
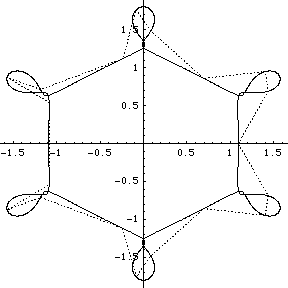
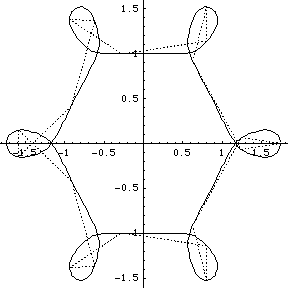
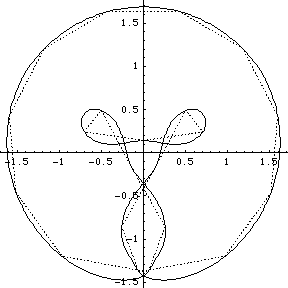
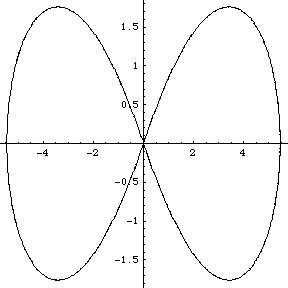
In 1998 Richard Montgomery and Alain Chenciner discovered a figure-eight orbit of the the planar gravitational 3-body problem; it turned out such an orbit had been suggested earlier in 1992, on the basis of numerical experiment using a Mac SE, by Cris Moore. This, Chenciner has remarked, seems to be characteristic of work on such a classic problem.
Following 1998, Carles Simó through numerical experimentation found a large number of new orbits of the planar N-body problem. They were similar to the new figure-eight solution in that they consisted of a single orbit around which the N bodies, all of equal mass and regularly spaced, chased each other. He called them choreographies because they seemed to be particles doing a dance; he termed them simple because the bodies all followed a single orbit.
At ICM 2002 in Beijing, August 2002, Chenciner delivered a very nice survey of recent progress in classical dynamics, including mention of these matters. At his lecture I was struck by the thought that perhaps by analyzing the figures formed by the bodies as they evolved, using a classical but rather obscure approach to parts of Euclidean geometry, with which I had recently been playing, maybe some additional insight might be won.
Simó published some results of his ingenious and sophisticated numerical work on the Web, in the form of about 40 lists of points and some scripts that allow the viewing of the orbits under the Unix utility GNUplot. Others, particularly Bill Casselman, wrote Java applets which allowed the viewing of many of the orbits on the Web. Casselmann's work was in connection with an article he prepared for the Notices of the AMS describing the exciting new discoveries of solution candidates for a classic problem.
I didn't have GNUplot to hand and I could not readily get hold of Casselman's applets, so I wrote routines in Mathematica 4.1 to display the orbits. Furthermore I wrote routines to display what I term the ‘geometrical Fourier transforms’ (GFT) of the orbits. These are the plots of the several non-zero components of the discrete Fourier transform of the figure made up by the evolving collection of N bodies. In fact the Fourier analysis concerned is simply that on the cyclic group ZN of integers modulo N. [A fuller analysis based on the corresponding symmetric group can be made too, but here we stick to the classsical, and simplest possible, case.]
We group the orbits and their GFTs according to the number of bodies involved. Click on a heading to go to the group page, which offers a larger image and the colored Fourier transform. Or click on a picture to go directly to that example.


