Los formantes de las vocales
due Wed 12/17 on CTools
Description
In this data analysis you will compare the vowel space of a native speaker to that of a non-native speaker. You will use Praat to annotate two speech recordings and to run a script to extract the formant values of each vowel. You will then analyze the data in Excel and summarize it in tabular and graphical formats. Finally, you will terminate this data analysis by writing a report.
Getting Started
Update Praat
-
Praat is frequently updated with new features and bug fixes, so it's best to always have the latest version!
-
Head over to http://www.praat.org (which will redirect you to http://www.fon.hum.uva.nl/praat/) to download the latest version of Praat. Select your platform by clicking on either Macintosh or Windows in the Download Praat section in the top left corner of the page.
-
If you are using a Mac, be sure to download the 64-bit version.
-
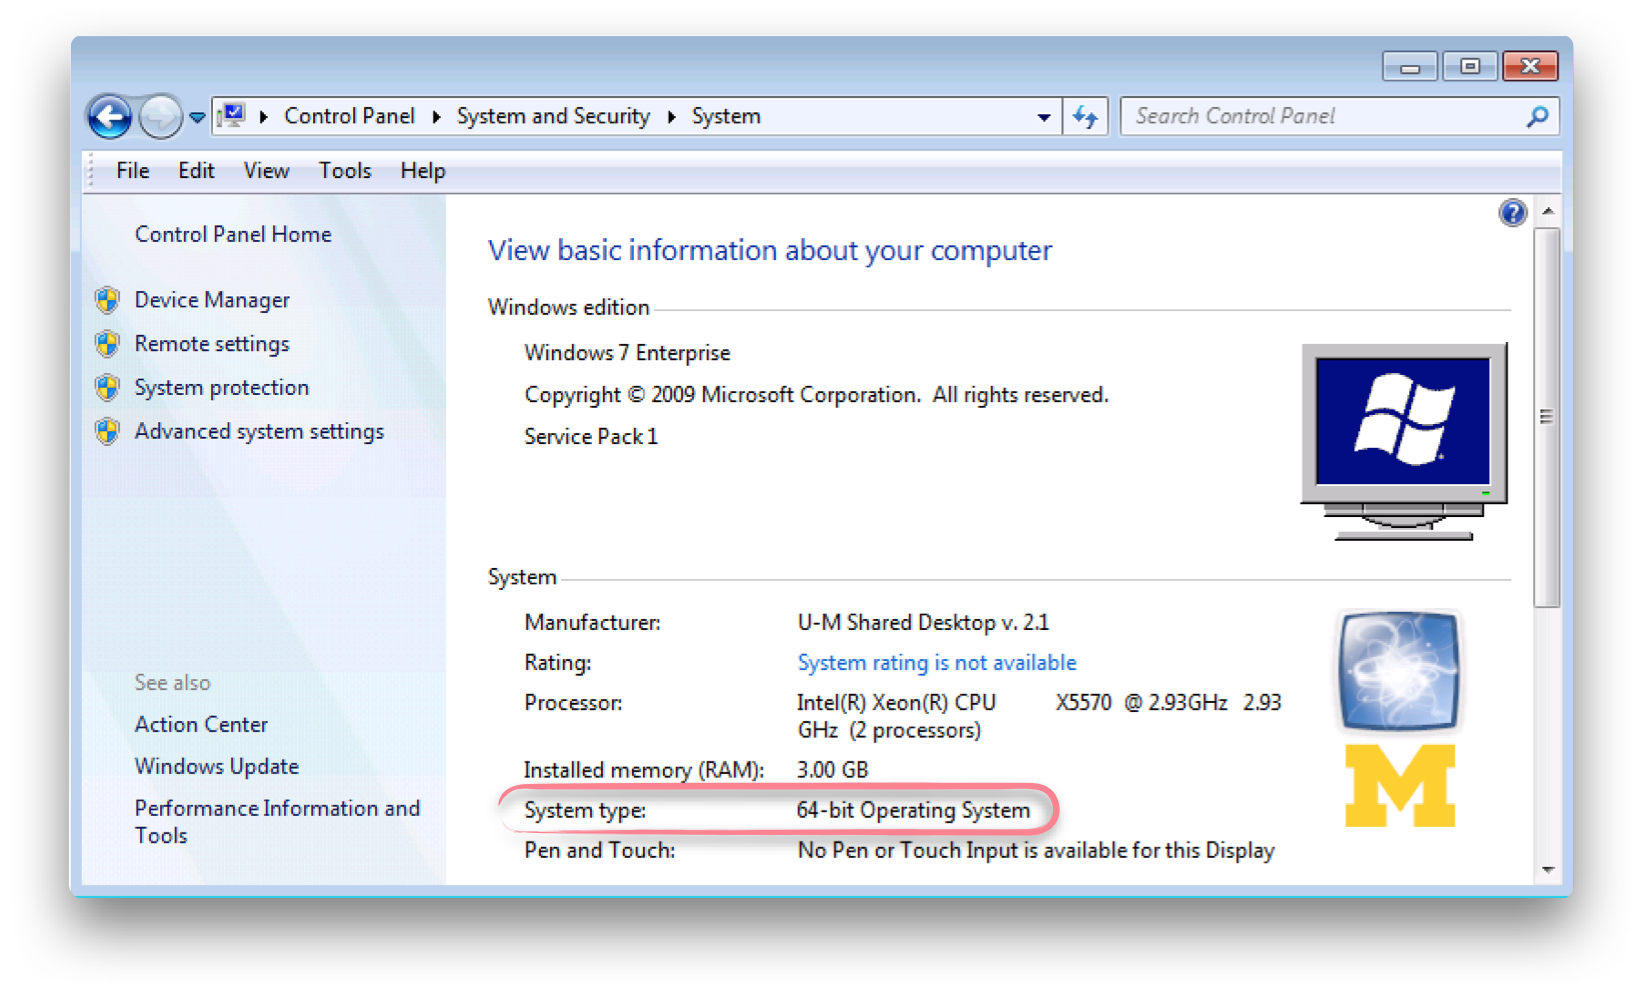
If you are working on a Windows PC, check if it is a 64-bit system. Open Control Panel and go to System and Security > System. The System type: line will detail the operating system type. If you have a 64-bit operating system, download the 64-bit edition of Praat, else download the 32-bit one.
-
-
Delete the older version of Praat from your computer and replace it with the new one to make sure that Praat is up-to-date.
Files
-
Download files, which include Praat script and Excel template by clicking the button on the left or via this link. Create a folder on your computer wherein you will keep all the files related to this project. Also consider backing up (via Time Machine, Dropbox, etc.), so as not to lose your work in case of an unforeseen event.
Labeling Vowels
-
First, watch this video on labeling vowels in Praat:
-
Open one of the two sound files. In Praat, click Open > Open long sound file… (since you will be working with files that are longer than several minutes). Then navigate to your file and click .
-
We will be using TextGrid to label vowels in our files. Create a TextGrid object by clicking and then To TextGrid…. Type segments in the field Tier names and leave Point tiers field blank, as shown in the below image:
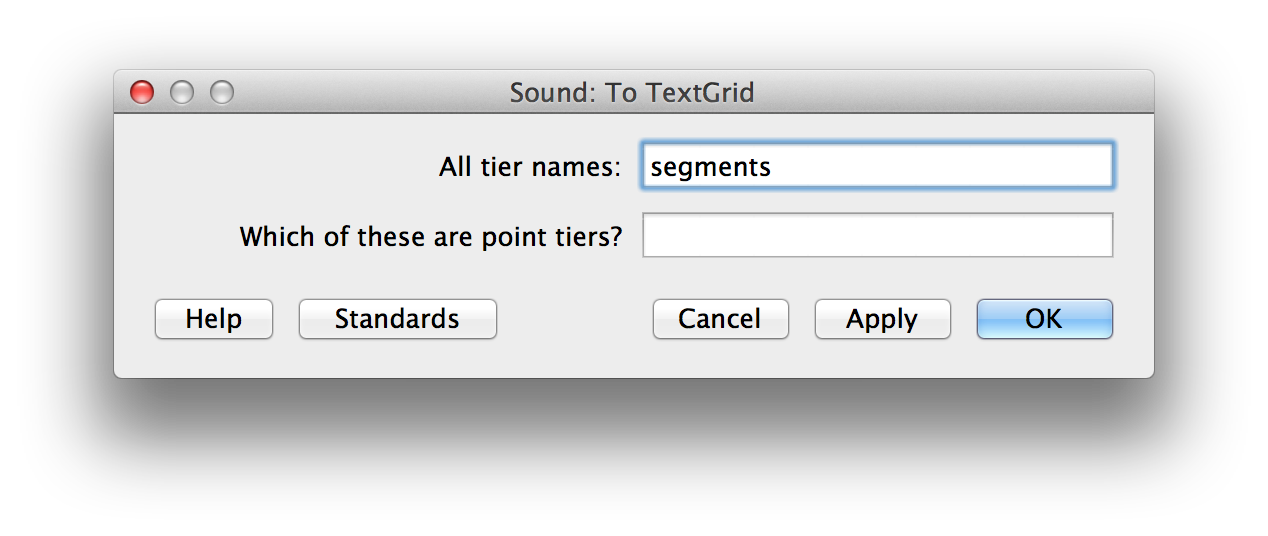
Click to create the TextGrid, which will show in the Praat object window.
-
Let’s open the TextGrid object. It is far more useful to view it with a sound file, so select both Long sound file and TextGrid by holding Shift and click to open them in the same window.
-
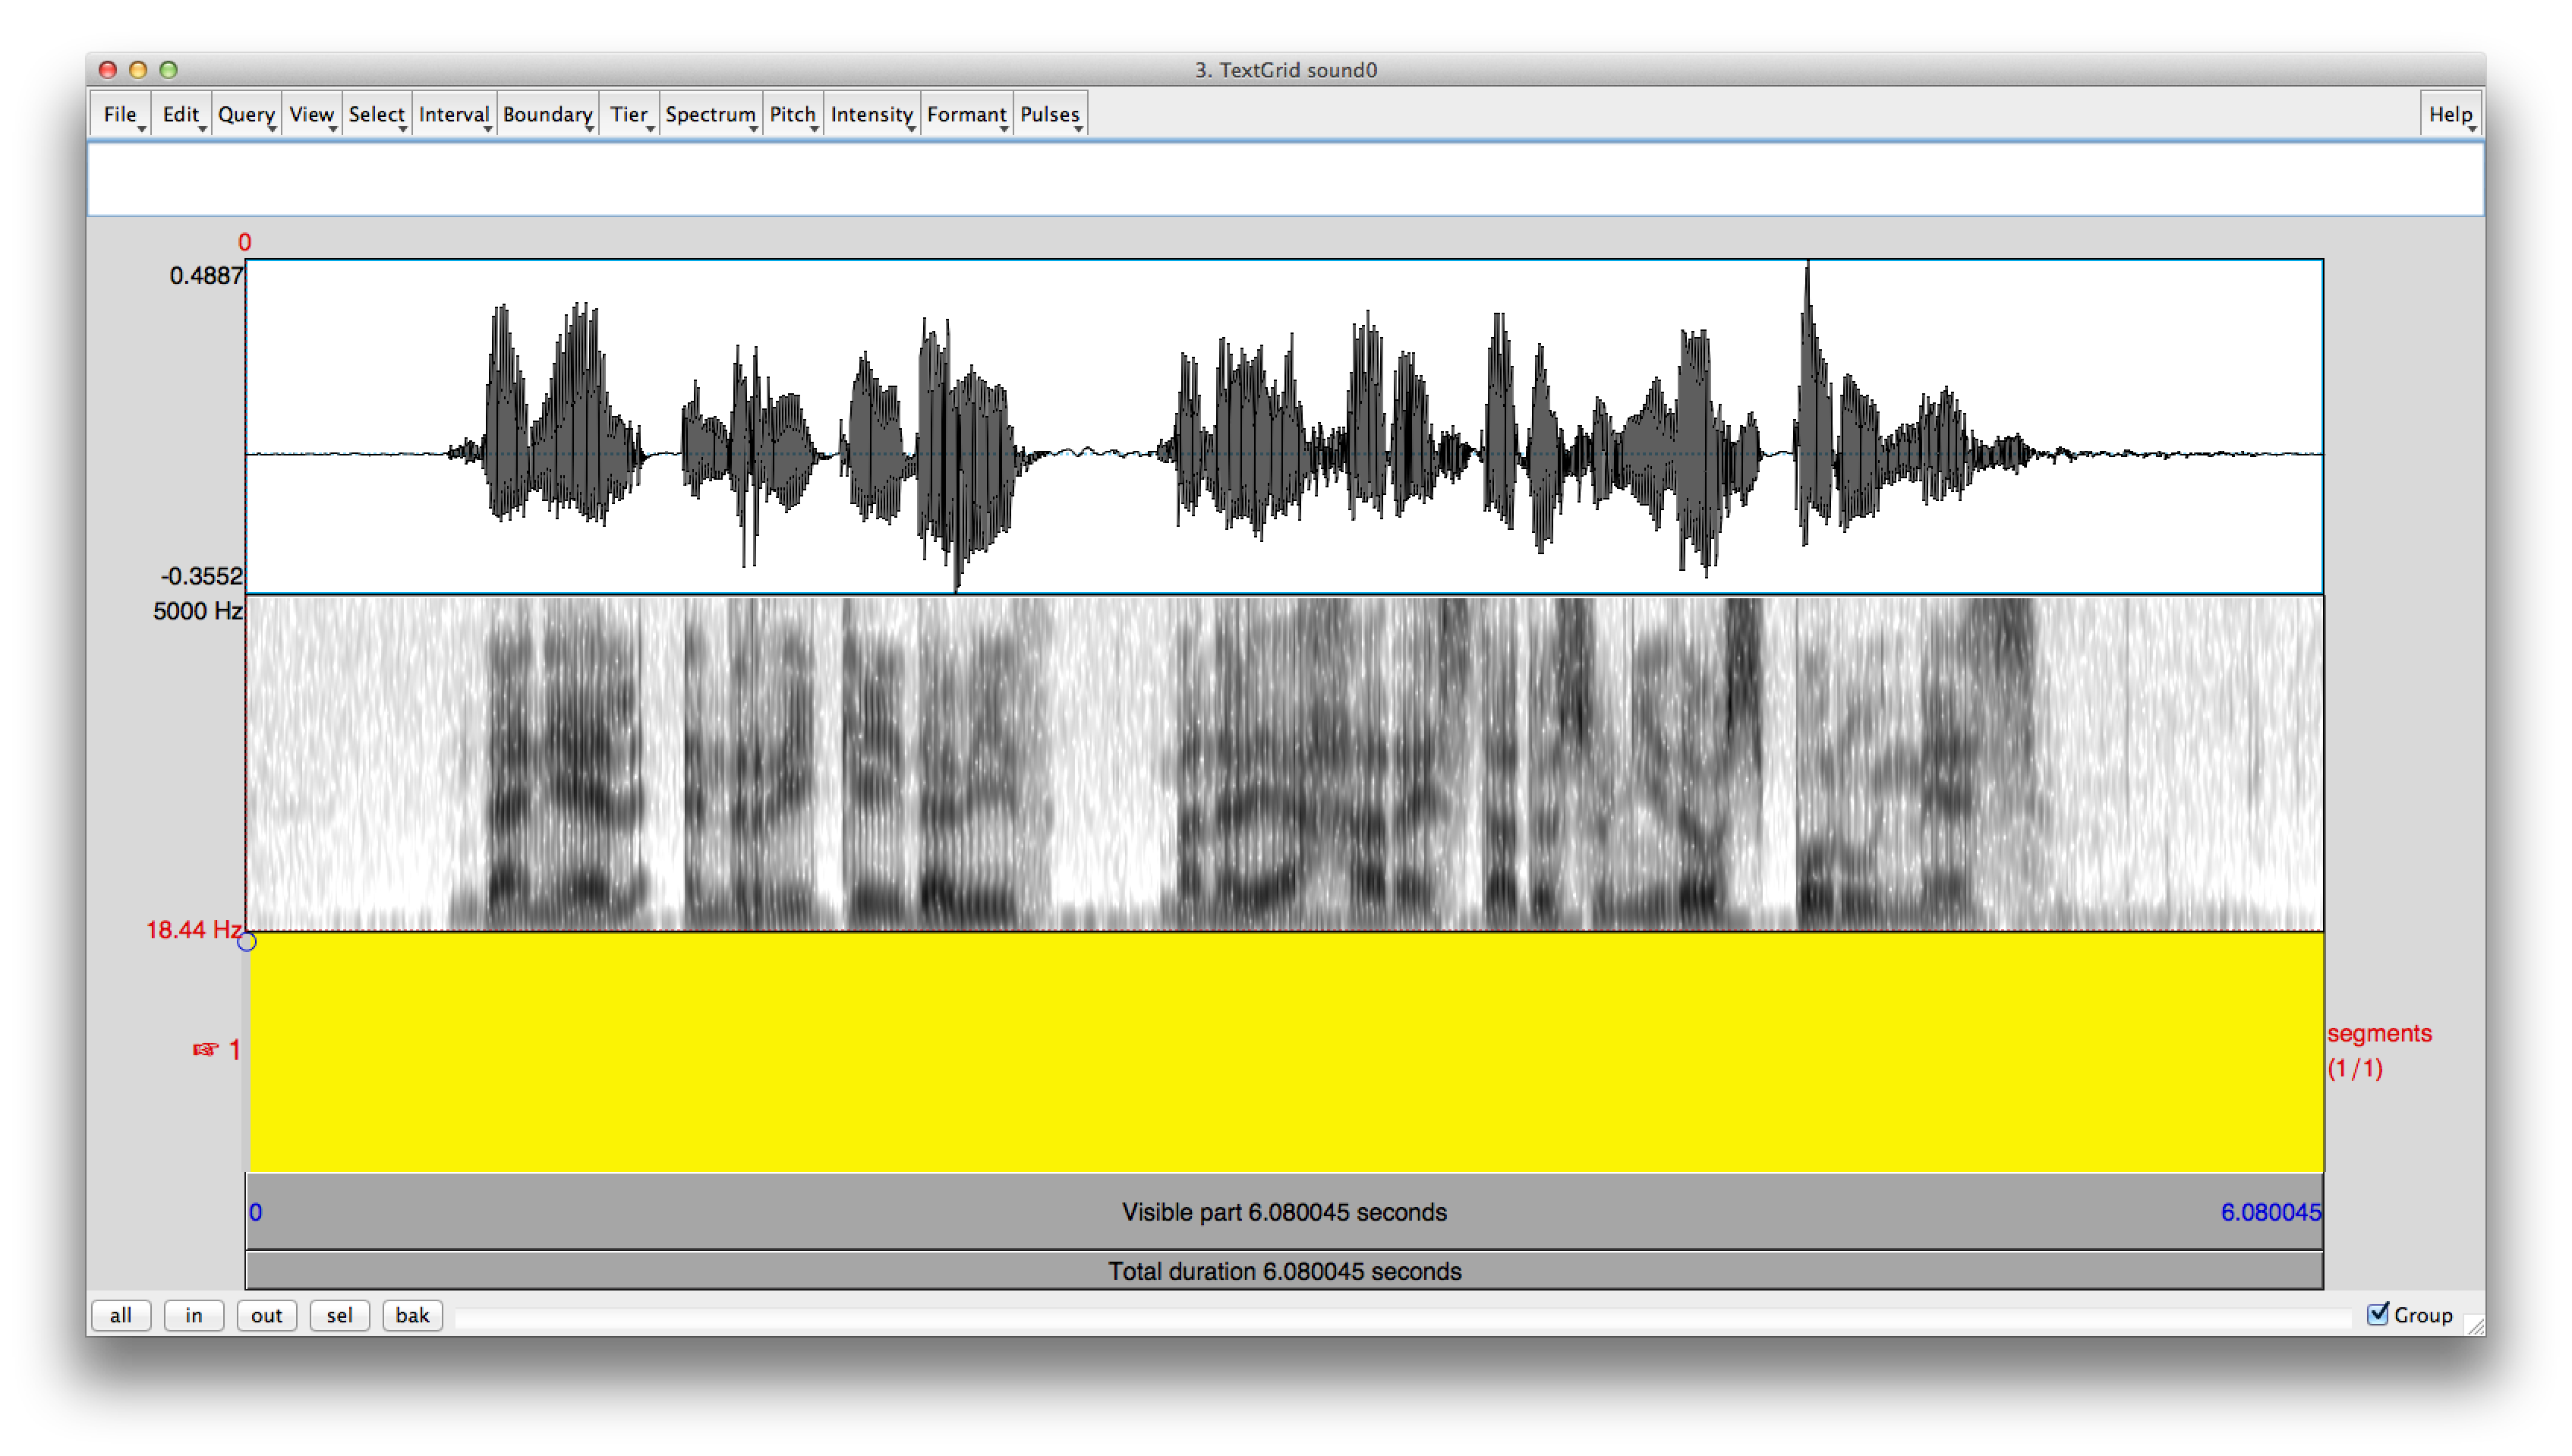
Your editor window should look similar to the one pictured above, with LongSound shown in the upper and central parts of the window (which are waveform and spectrogram, respectively) and TextGrid in the lower part. If you see blue lines, yellow lines or red dots on the spectrogram, then Praat is configured to show pitch, intensity or formants. While these might be helpful when labeling vowels, they will significantly slow Praat down, as it will have to redraw them every time you scroll. So be sure to uncheck them by clicking on Pitch, Intensity and Formant and unchecking Show pitch, Show intensity and Show formants.
-
Now it’s time to label the vowels. They are usually the darker regions on the spectrogram, so they are relatively easy to spot. You will probably want to zoom in to locate vowels more accurately. Remember the following keyboard shortcuts when working with Praat:
Action Mac Windows Zoom in Command-I Control-I Zoom out Command-O Control-O Zoom to selection Command-N Control-N Zoom all Command-A Control-A Play or stop Tab Tab Delete a boundary Option-Delete Alt-Delete Undo Command-Z Control-Z -
We’ll label the vowels by creating intervals on the TextGrid. When you have found a vowel, click on the starting point of the vowel on the waveform or spectrogram and then press Enter on your keyboard to add a left boundary. Next, click on the ending point and press Enter to add a right boundary. You have now created an interval! Alternatively, use the mouse to select a region and then press Enter on your keyboard to create an interval in one step. Note that you can click and drag a boundary left or right to adjust it. You can also press Option–Delete on Mac or Alt–Delete on Windows to delete a boundary you no longer need.
-
Once you have an interval, click on it in the TextGrid part of the window. Press Tab to play it and make sure that you have selected the right region. Adjust it if not. You can also select a portion of the sound file before and after the vowel and listen to it by again press Tab to confirm that your selection is indeed correct.
-
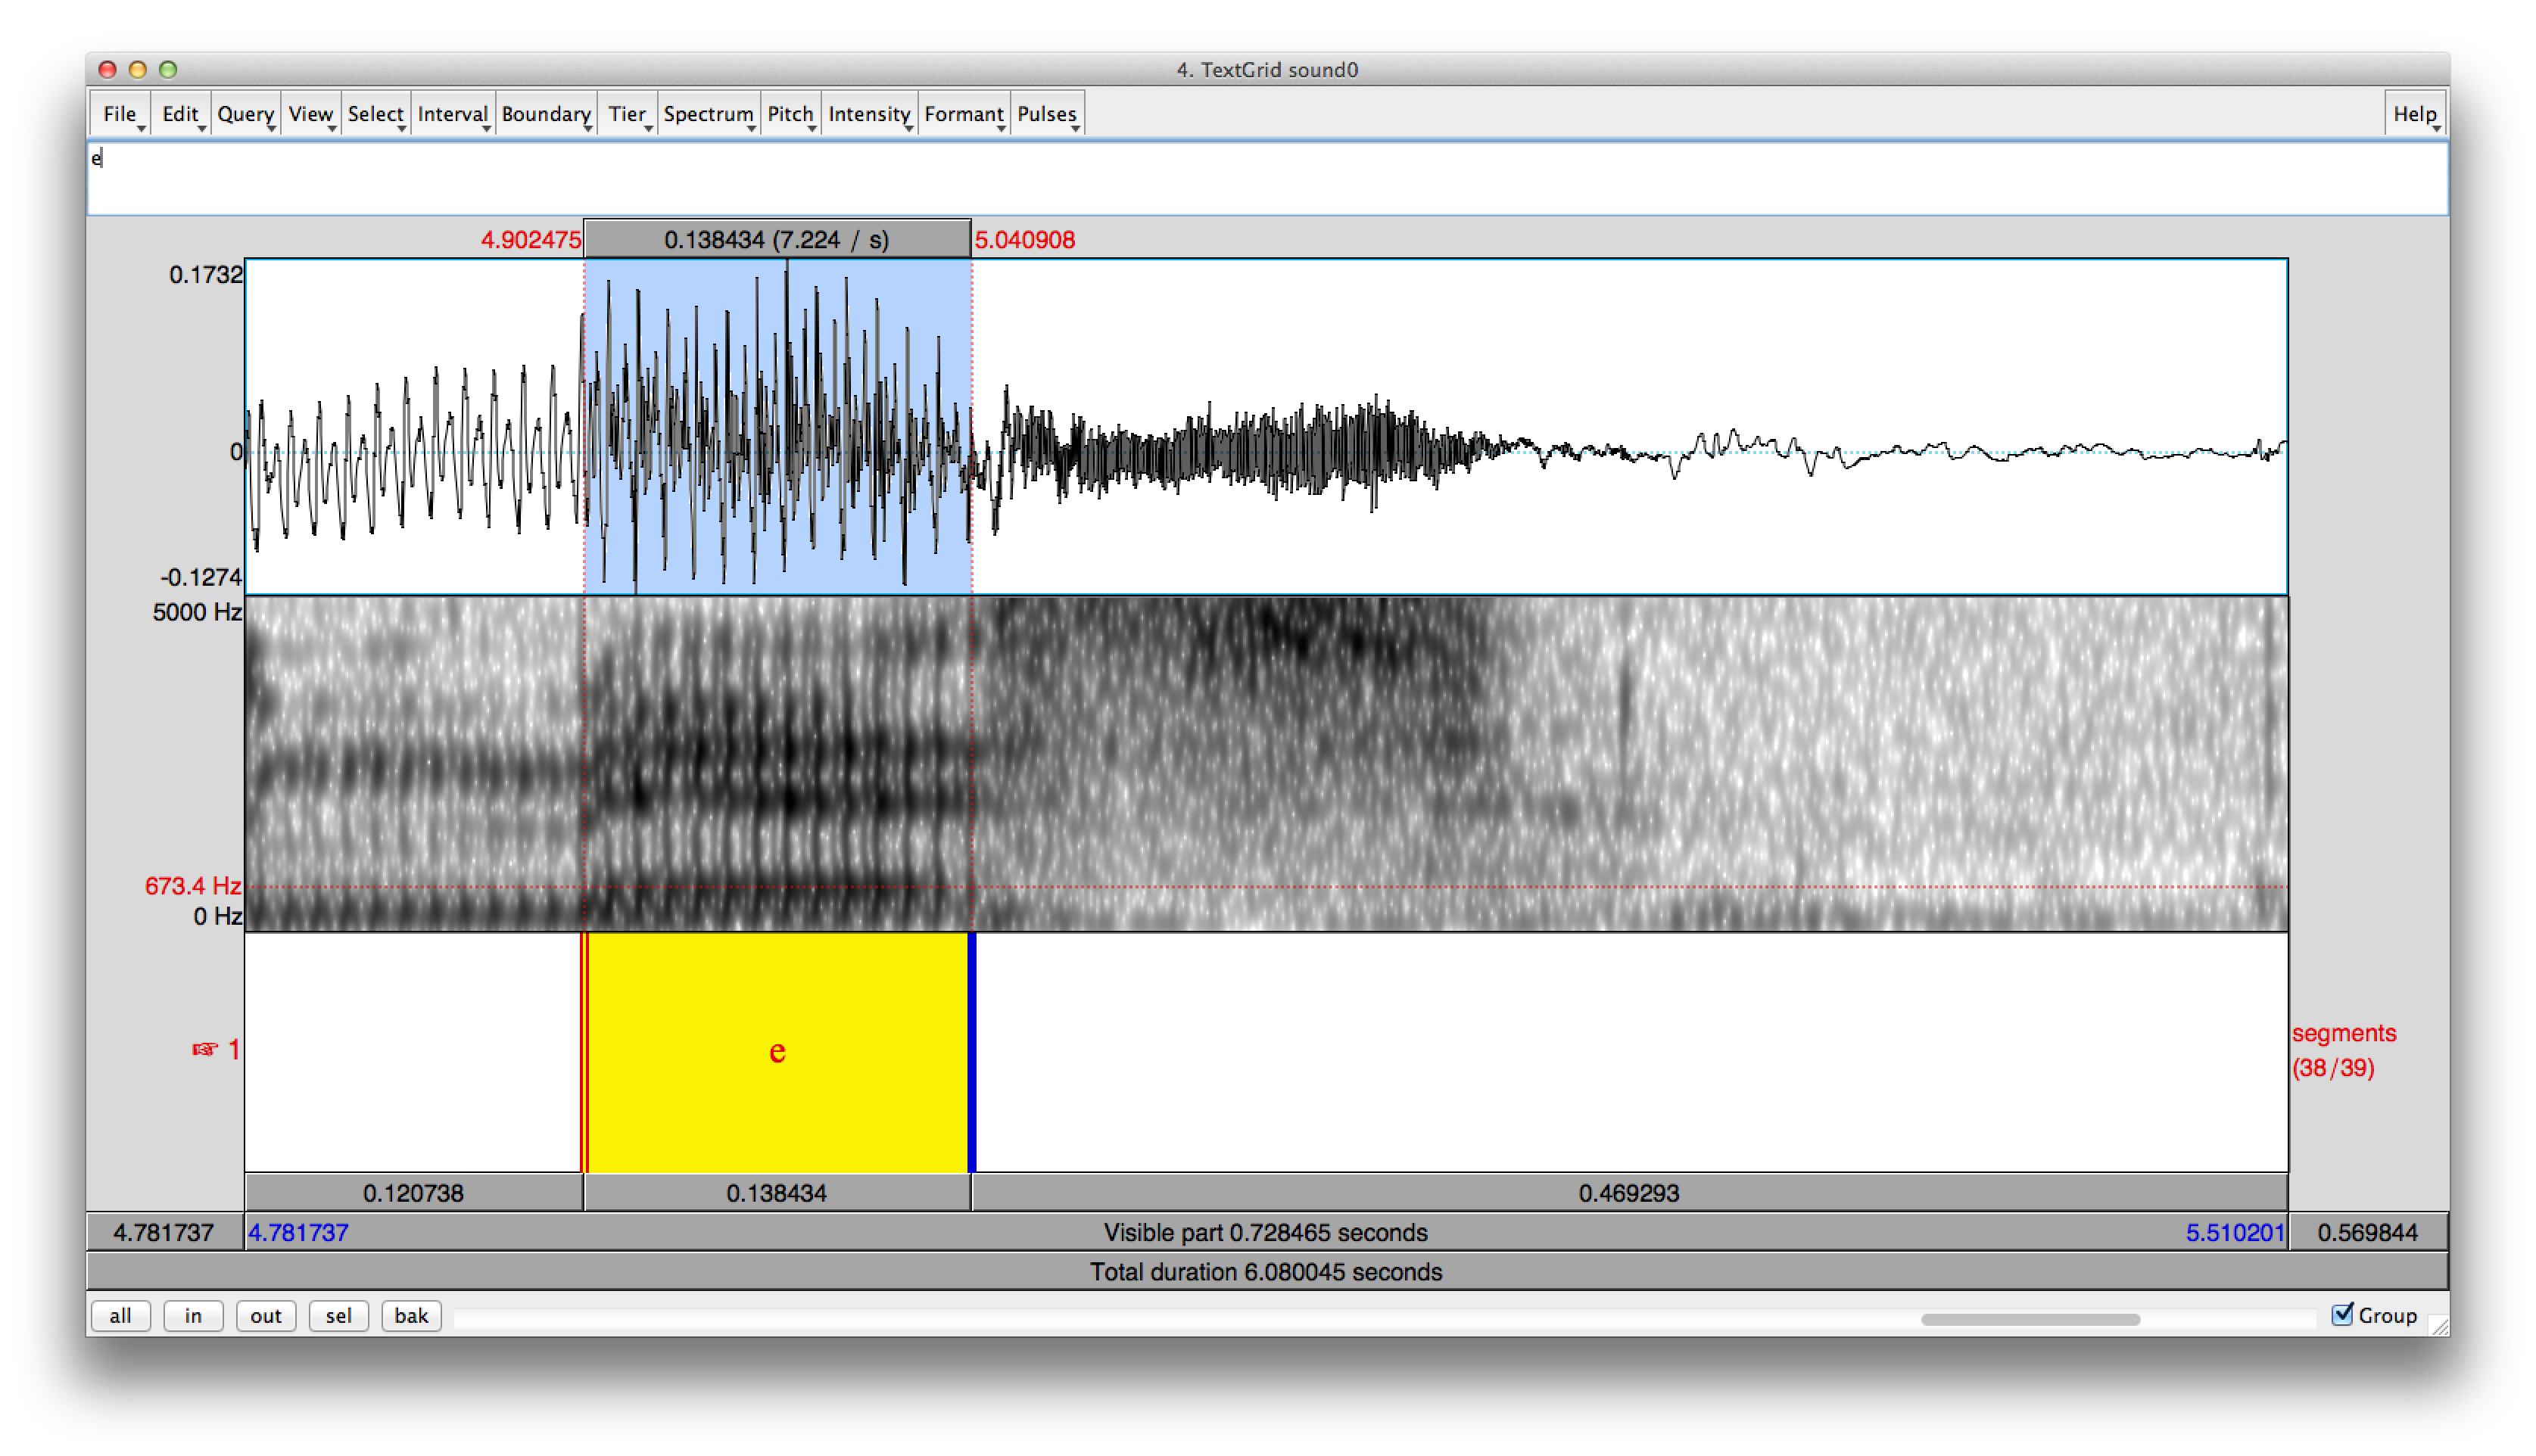
Next, label the interval by typing the name of the vowel that the interval represents on your keyboard. A labeled vowel should look something like this:
-
Repeat this process to label the rest of the vowels in the sound file. You must label at least ten examples of each of the vowels /a, e, i, o, u/ for the speaker. No need to label diphthongs.
Once you have labeled the vowels, save the TextGrid object. Click File in the editor window and then Save TextGrid as text file.... Choose the destination (which should be the same folder as the location of the sound file) and click .
-
Finally, open the second sound file and label /a, e, i, o, u/ therein. You should have 50 more vowels, for a total of 100 tokens across two speakers. Save the TextGrid object.
Script
-
We'll use a script to ask Praat to extract the formant frequencies of the labelled vowels.
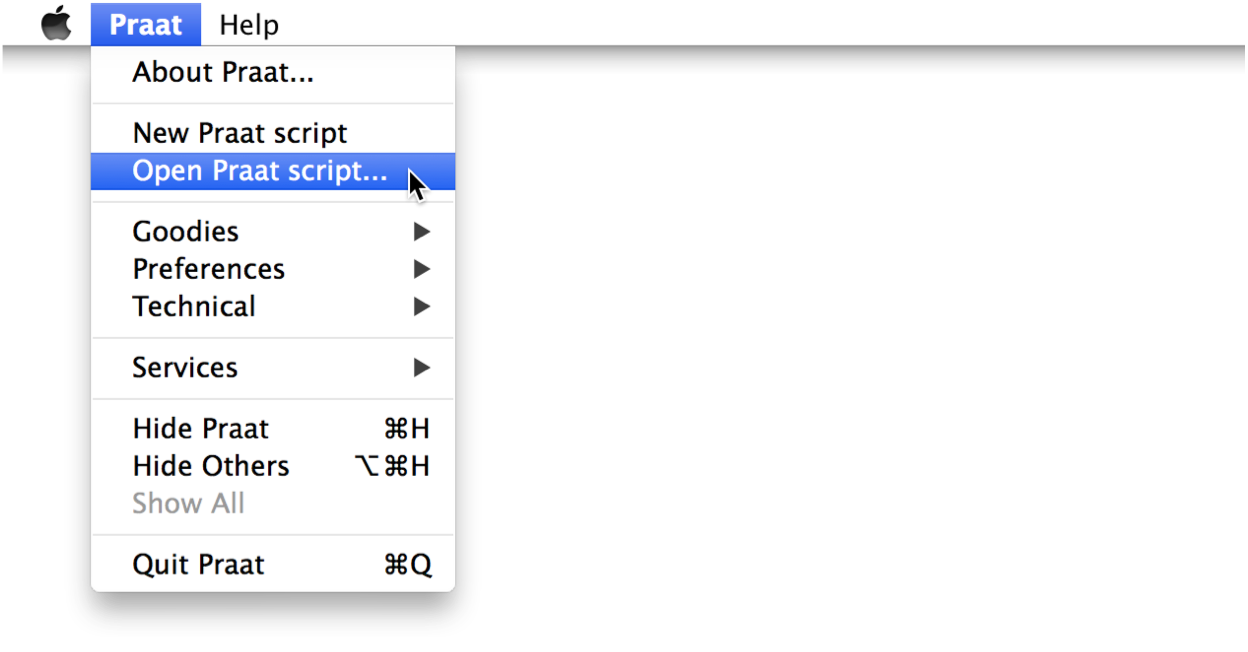
Double-click on occlusions.praat to open it. Alternatively, click Praat and then Open Praat script… in the menu bar. Then navigate to occlusions.praat and click to open.
-
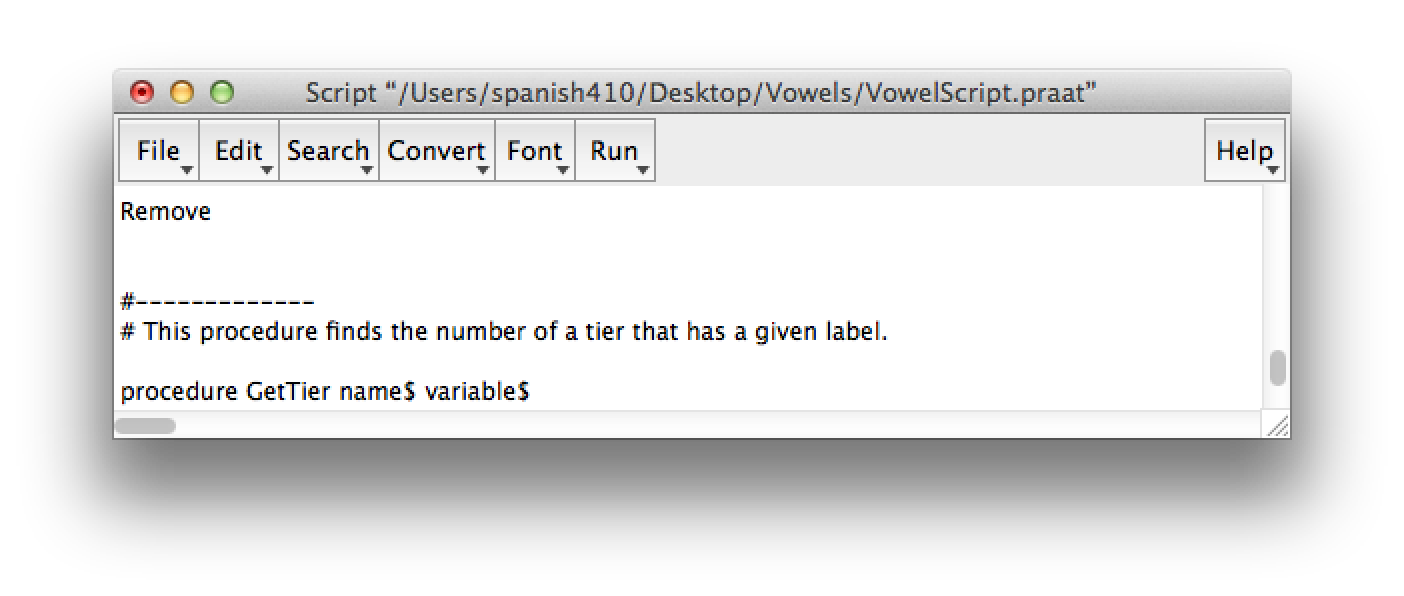
A script editor window should appear. To execute the script, click Run and then Run again.
-
Type the complete paths to the directory of your sound files and TextGrid files. If they are in the same folder as the vowel script, you can simply copy the directory from the script’s title bar, but be sure to not include VowelScript.praat:
File names
Be sure that sound files and TextGrids have the same names (although their extensions will be different) and are located in the same folder.
If your files are in a folder called AD3 on your Desktop, then the path should look something like this if you are on a Windows computer:
And like this if you are using a Mac:
Drag and drop
If you are using a Mac, save some time by dragging your project folder and dropping it into a blank textfield instead of manually typing the directory. Be sure to append a / (forward slash) to specify that the path is to a folder.
-
Finally, type the full path of the resulting file. Put it in the folder where your sound file, TextGrid file and the script are located and name it results.xls, so that it can be easily opened in Excel. Make sure that the path to the resulting file looks like this if you are using Windows:
And if you are on a Mac:
-
Click to run the script.
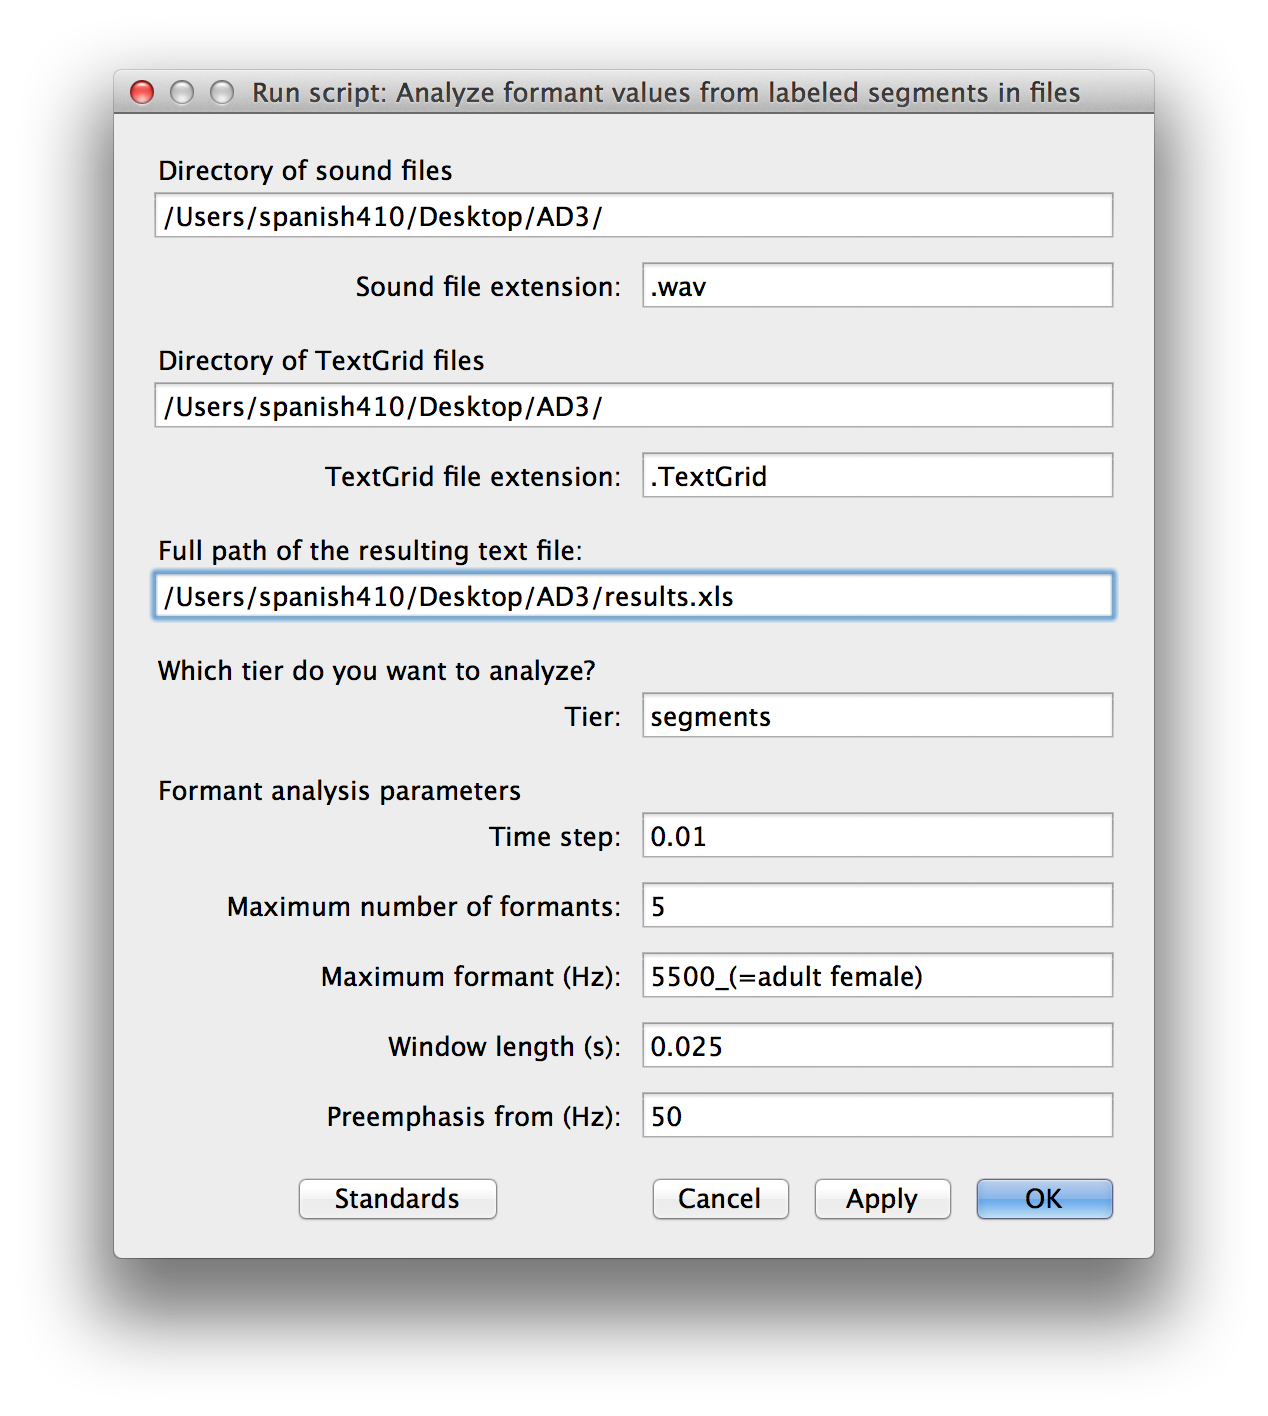
For each interval that you labeled, the script will output the name of the file, the vowel, as well as F1 and F2 frequencies.
-
This video illustrates the process of running the script in Praat.
Tables and Graphs
-
Let's next take a look at Excel in this video:
Virtual Sites
If you do not have Excel on your computer, know that you can gain access to it via Virtual Sites.
-
Open Vowel chart.xlsx which contains a template with two table and a vowel diagram. The vowel chart is linked to the tables and will automatically update as you input values. Change Hablante A and Hablante B to Hablante nativo(a) and Hablante no-nativo(a) accordingly in the tables.
-
Then open results.xls that was output by the Praat script. This file contains the raw data from the two sound files. This is the data that you will need to use for the table and graphs.
Copy Data
-
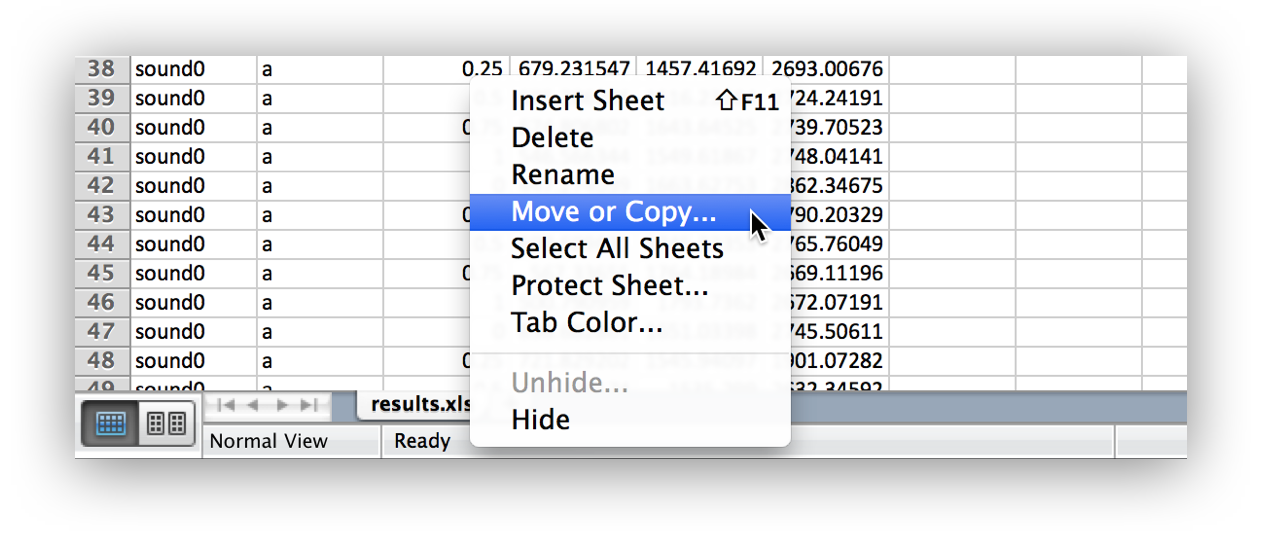
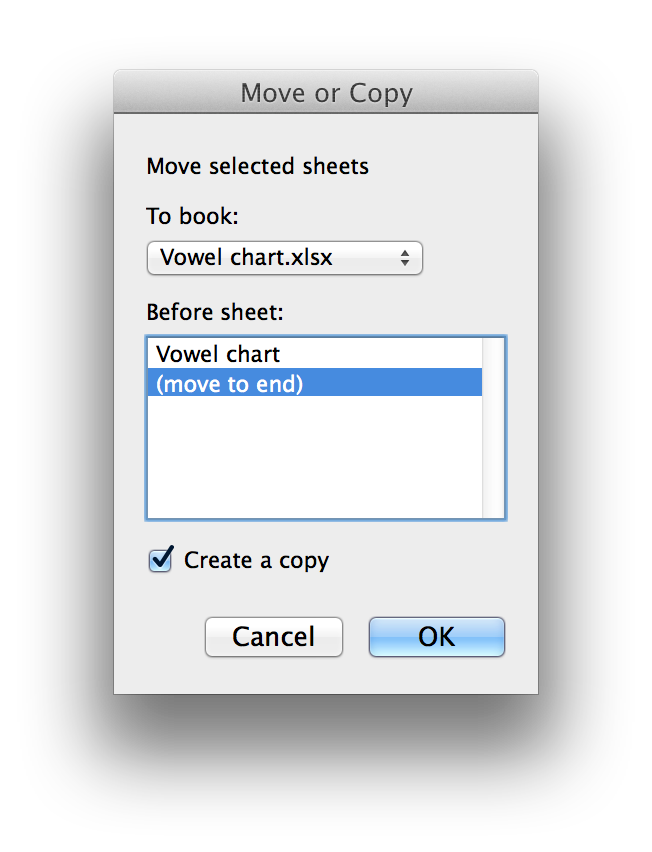
Copy the data from results.xls to Vowels.xlsx. Right-click (or Control-click on a Mac with a trackpad) on the tab titled results.xls in the bottom of the window and then click Move of copy….
-
Select Vowel chart.xlsx from the drop-down menu as the destination and then check the checkbox titled Create a copy. Click . You may now close results.xls window.
Average Frequency
-
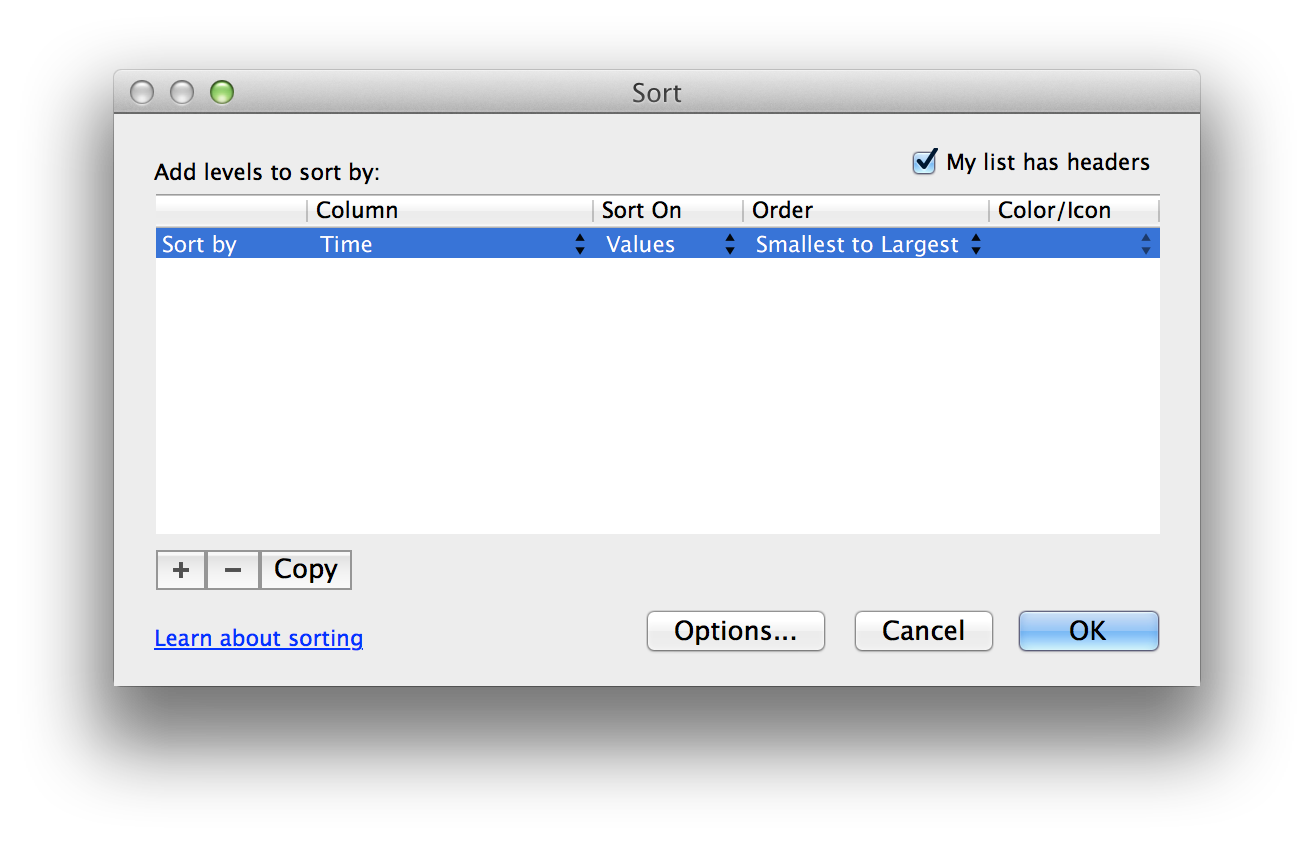
Now close results.xls file. Come back to Vowel chart.xlsx and you will see the results in the recently copied sheet. We are interested only in certain data, so we’ll delete what we don’t need. First, we’ll delete 0, 25, 75 and 100 per cent points, keeping only 50 per cent. To do this quickly, we will first sort the data. In the menu bar, click and then . Under Column, select Time in the the drop down menu and click .
-
Go ahead and highlight the headers of those rows that have values 0 and 0.25 in the column Time. Then right-click and click . Note that pressing the Delete key on the keyboard will delete the contents of a cell and not the rows. Next highlight the headers of rows with values 0.75 and 1. Again, right-click and click .
-
Because we will only use F1 and F2 frequencies, we can delete the column with F3 values. Click on the header F, then right-click and click .
-
Next, we will find the average frequencies F1 and F2 for each vowel. First, sort the data again, but this time by vowel. In the menu bar, click Data and then Sort…. Under Column, select Segment label in the the drop down menu and click .
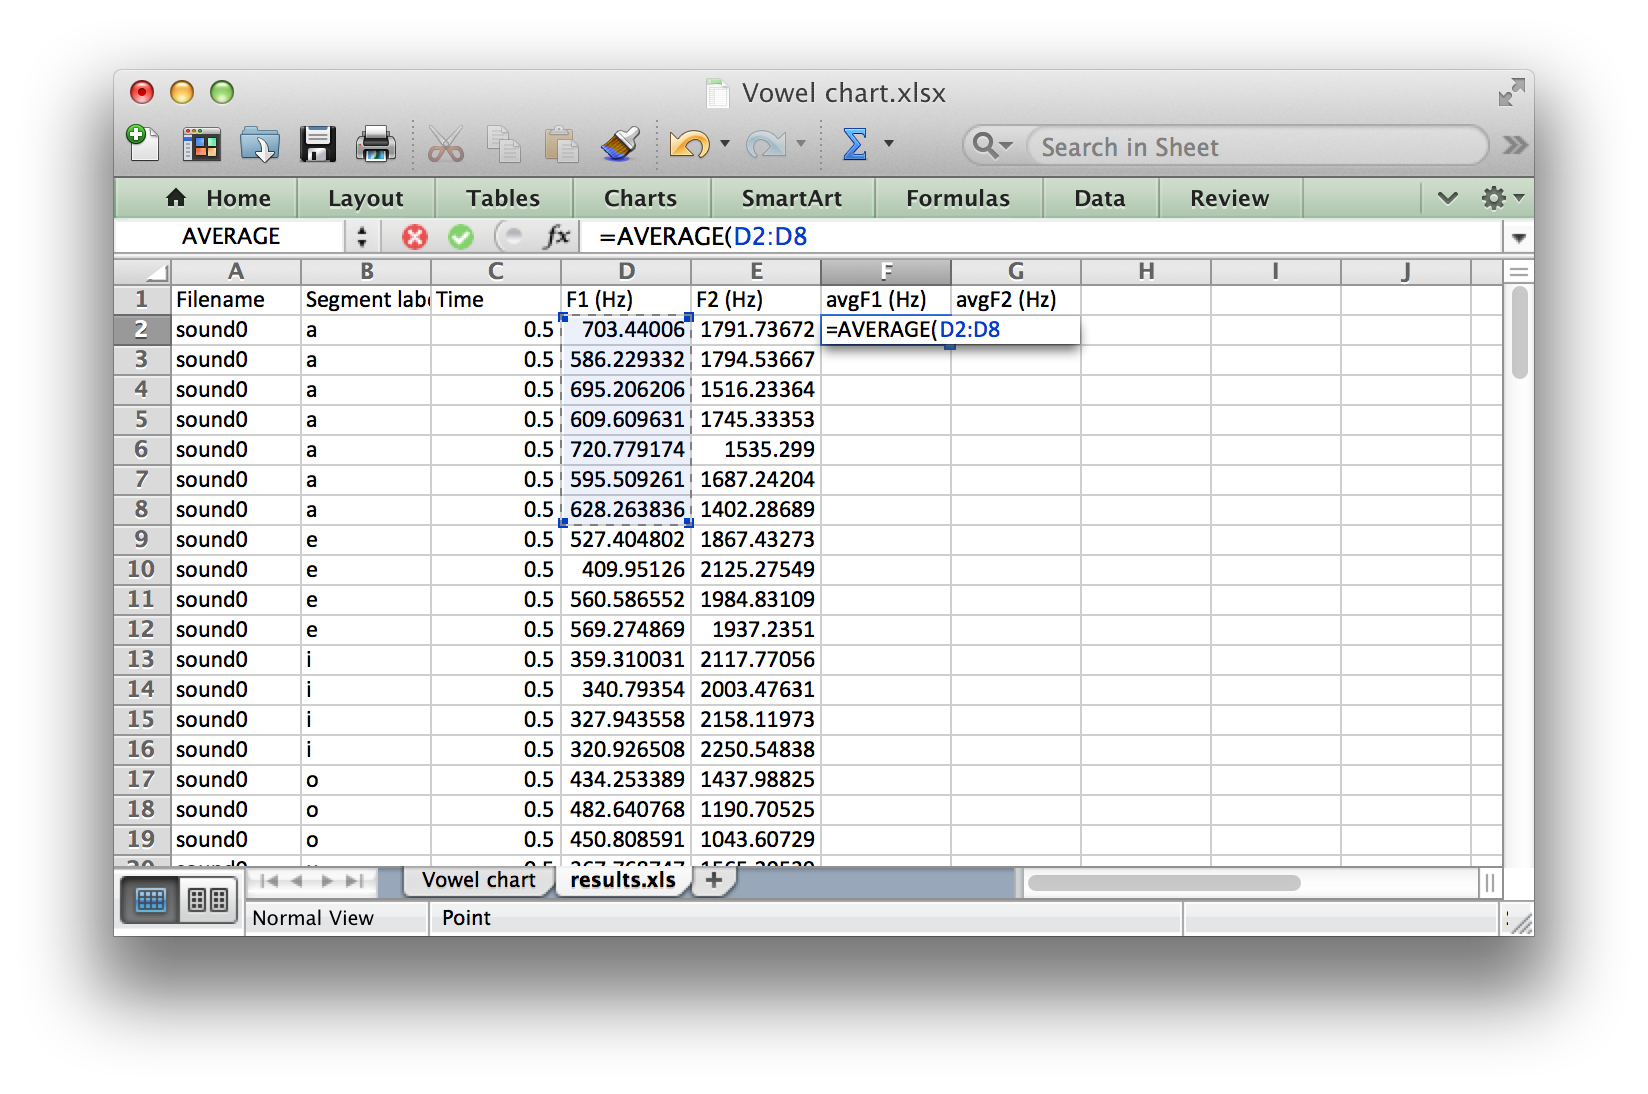
Create two new columns. Name one avgF1 (Hz) and the other avgF2 (Hz). You will need to calculate the average of F1 and F2 for each vowel. You can ask Excel to do it by giving in a a formula. In the cell corresponding to the first row of the vowel /a/ and column avgF1 (Hz), type =AVERAGE(. Then use the mouse to select all the cells with F1 values for /a/ and press Enter on your keyboard.
-
Repeat this process for the remaining averages of F1 and F2 for all vowels of both speakers
Build a chart
-
Go back to the Vowel chart sheet by clicking on the tab Vowel chart on the bottom of the Excel window.
Quilis and Esgueva, 1983
Consult page 128 of José Ignacio Hualde's The Sounds of Spanish (2005) for average F1 and F2 values reported by Quilis and Esgueva (1983) in a spectrographic study, if of interest.
-
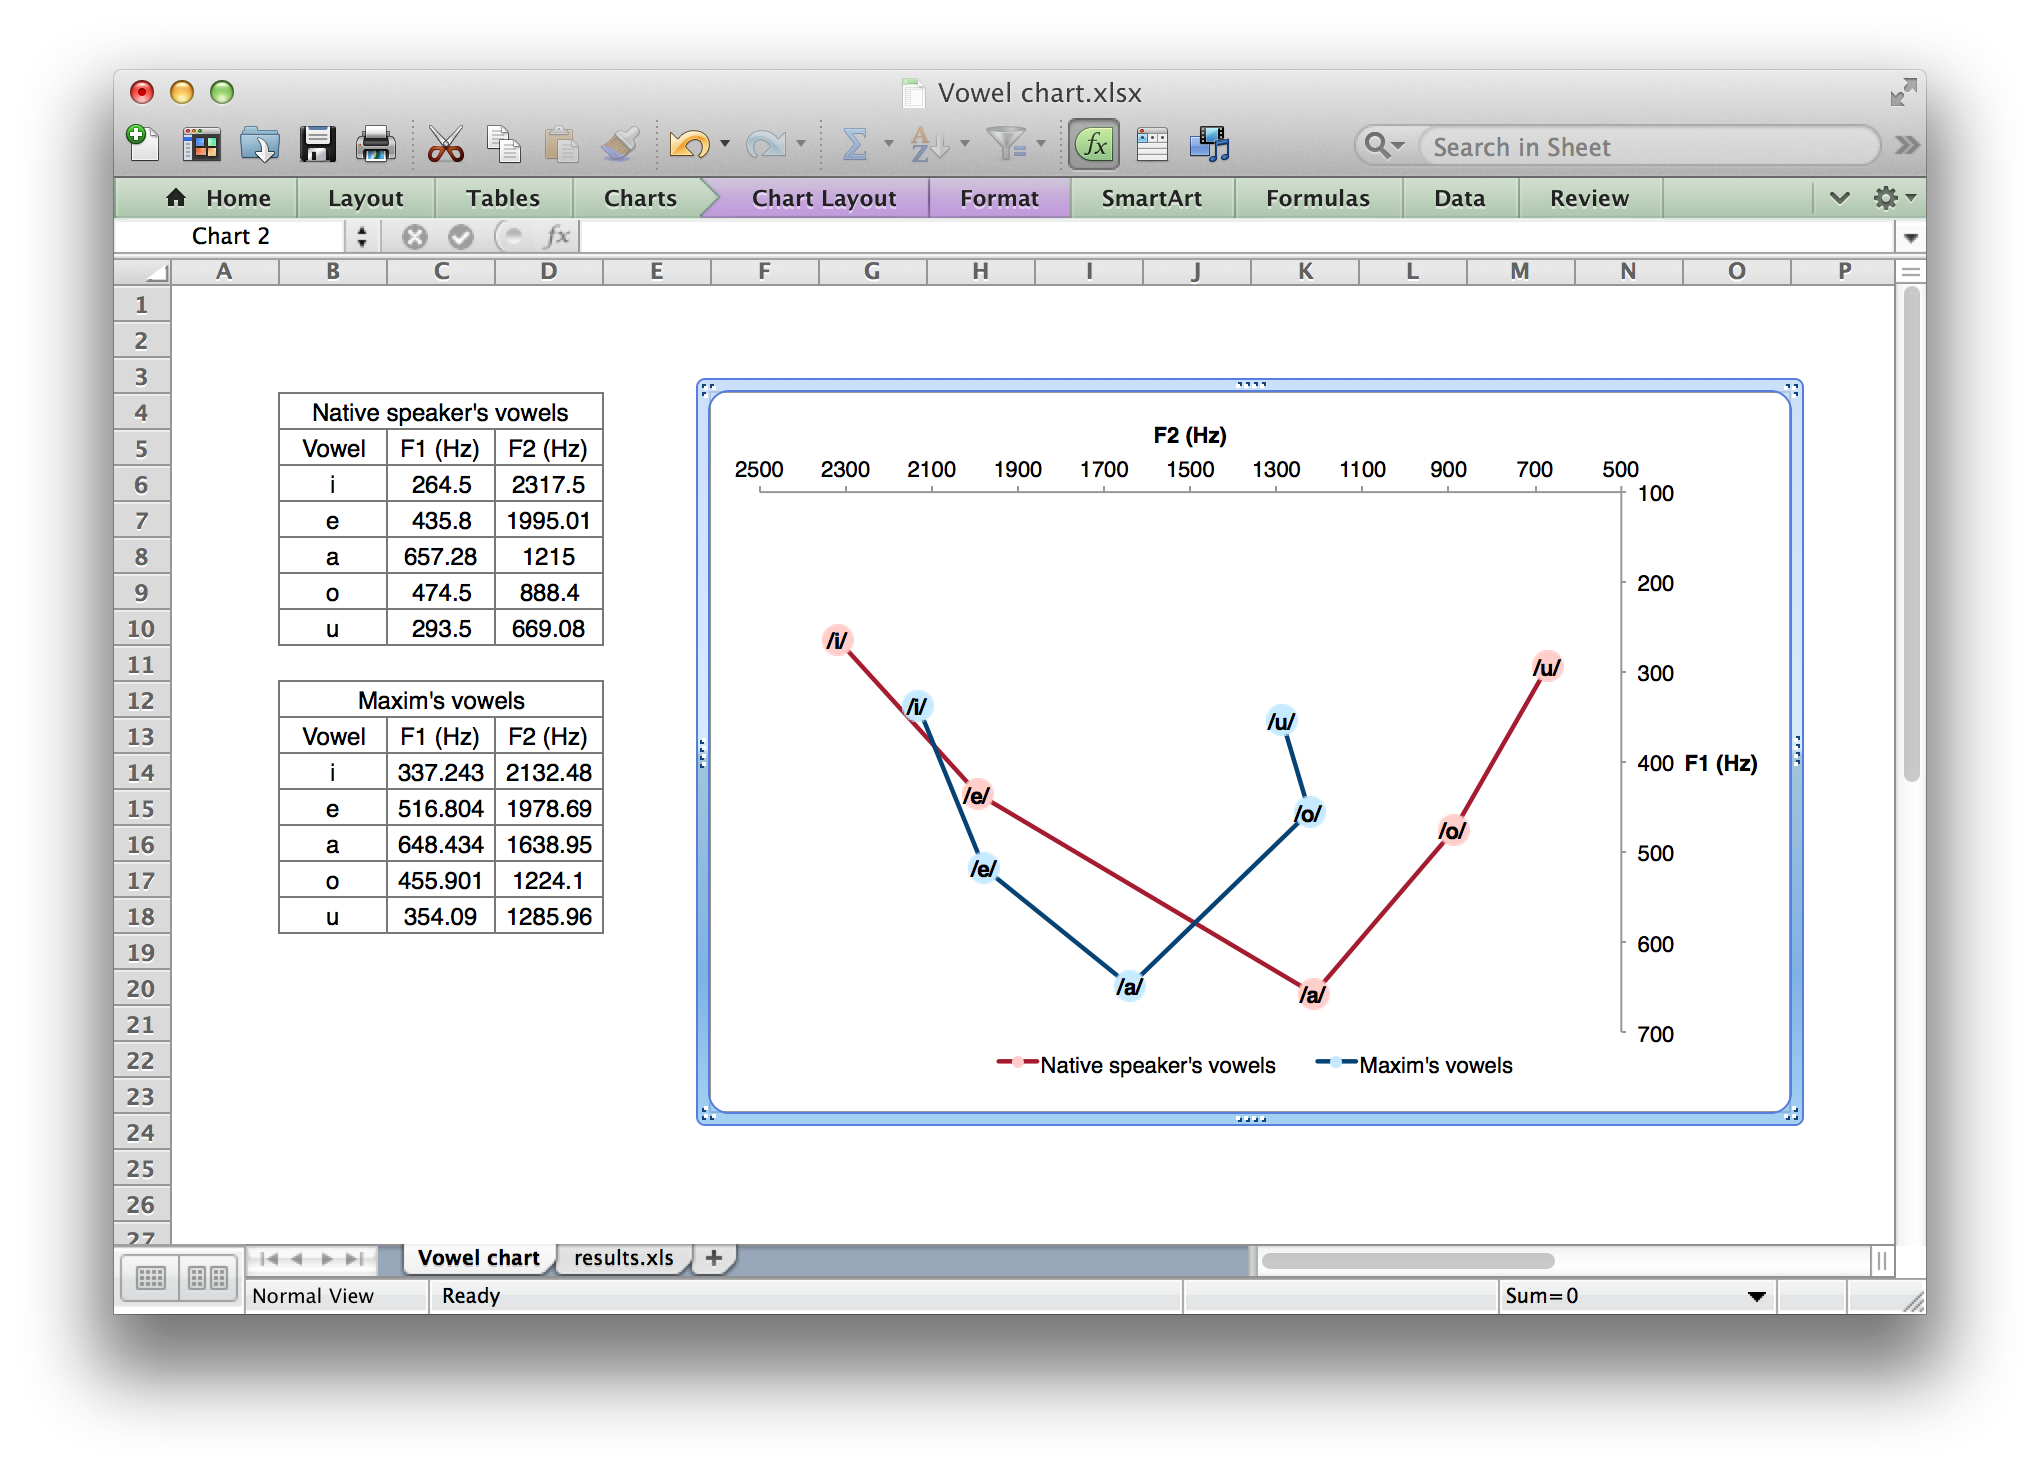
Okay, you now need to provide the values of the vowels. But instead of manually typing or copying and pasting them, you should reference them, so that any changes in the original data will be reflected in the chart. So first click on a cell, type = (equal sign), then head to results.xls sheet, click on the cell you want to reference and press Enter. Do this for the rest of the values. Once you have finished, you should have a vowel chart similar to the one below.
What's Next
-
Write a report as per the guidelines on CTools. Be sure to include tables and graphs. Once you have finished with your report, review it checking that you have made no errors and that you have included all the necessary components and details.
-
Submit the report online via CTools by Wed 12/17.