Análisis de datos 2: La vibrante múltiple
Report due Thu 4/30 via Canvas
Description
In this data analysis you will examine trill phonemes in Spanish (e.g. initial r in the word rana or an intervocalic double r, as in the word perro) produced by two speakers. You will use Praat to annotate two speech recordings and to run a script to extract the duration of each trill. You will then analyze the data in Excel and summarize it in tabular and graphical formats. Finally, you will terminate this data analysis by writing a report.
Getting Started
Update Praat
-
Praat is frequently updated with new features and bug fixes, so it's best to always have the latest version!
-
Head over to http://www.praat.org (which will redirect you to http://www.fon.hum.uva.nl/praat/) to download the latest version of Praat. Select your platform by clicking on either Macintosh or Windows in the Download Praat section in the top left corner of the page.
-
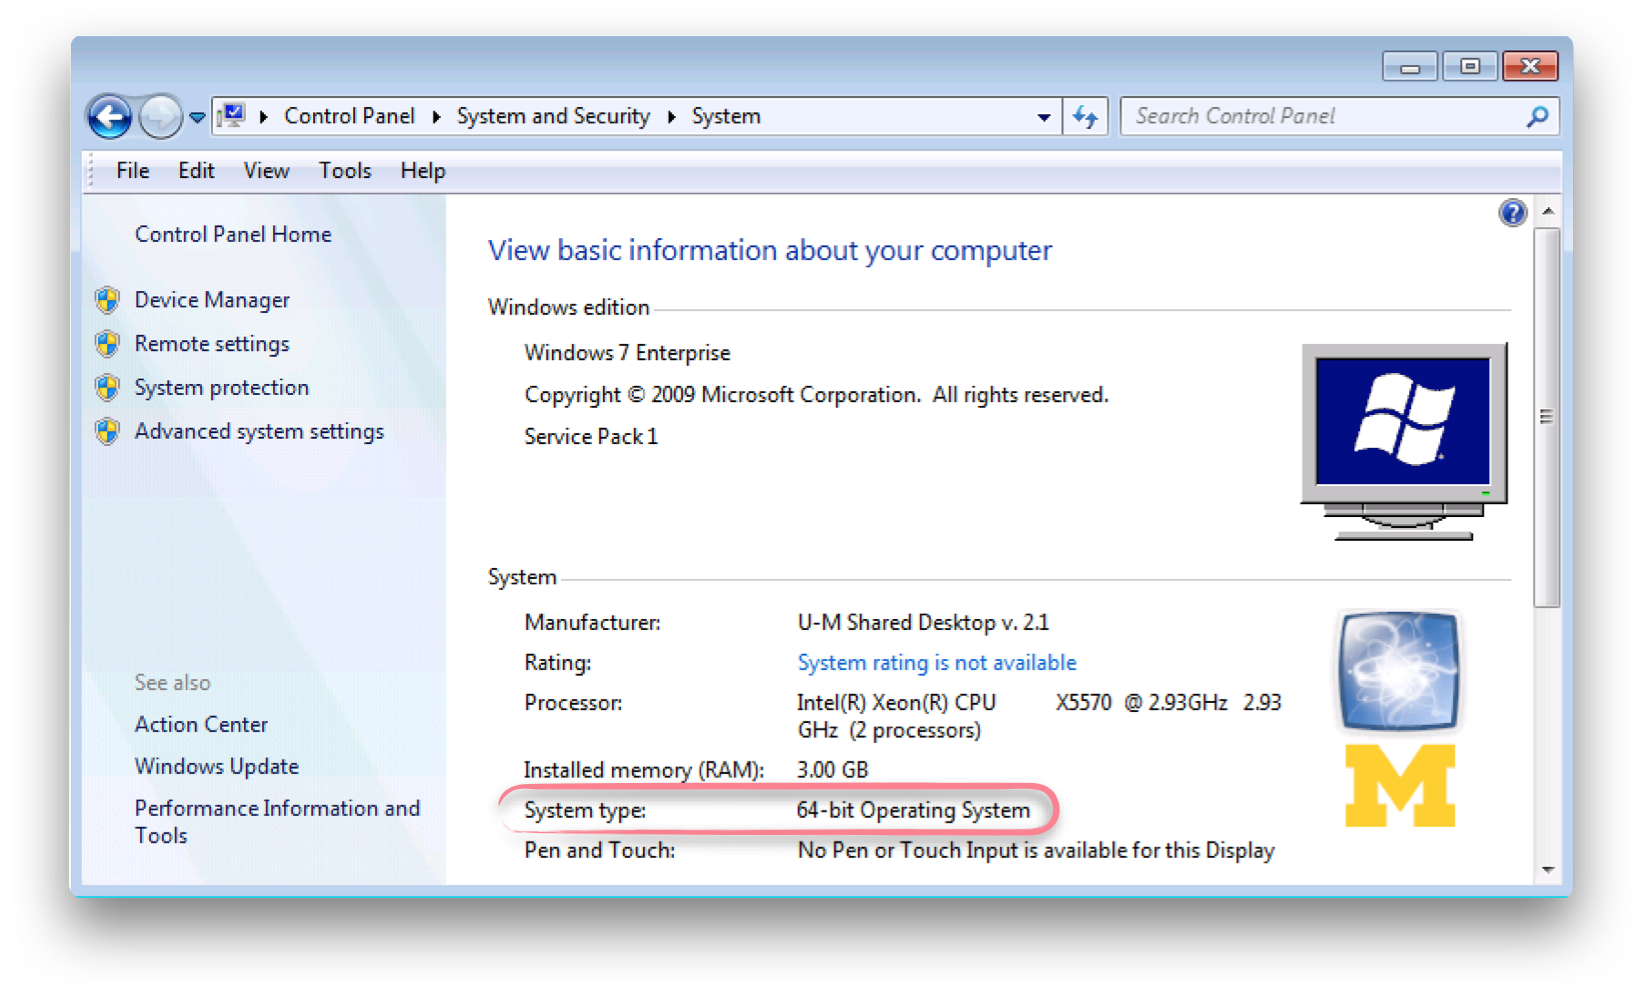
If you are using a Mac, be sure to download the 64-bit version.
-
If you are working on a Windows PC, check if it is a 64-bit system. Open Control Panel and go to System and Security > System. The System type: line will detail the operating system type. If you have a 64-bit operating system, download the 64-bit edition of Praat, else download the 32-bit one.
-
-
Delete the older version of Praat from your computer and replace it with the new one to make sure that Praat is up-to-date.
Files
-
Download files, which include Praat script and Excel template by clicking the button on the left or via this link. Create a folder on your computer wherein you will keep all the files related to this project. Also consider backing up (via Time Machine, Dropbox, etc.), so as not to lose your work in case of an unforeseen event.
Acoustic Analysis
-
First, watch this video on labeling phonemic trills in Praat:
-
Open one of the two sound files. In Praat, click Open > Open long sound file… (since you will be working with files that are longer than several minutes).
-
Create a TextGrid object by clicking and then To TextGrid…. Type text in the field Tier names and leave Point tiers field blank, as shown in the below image:
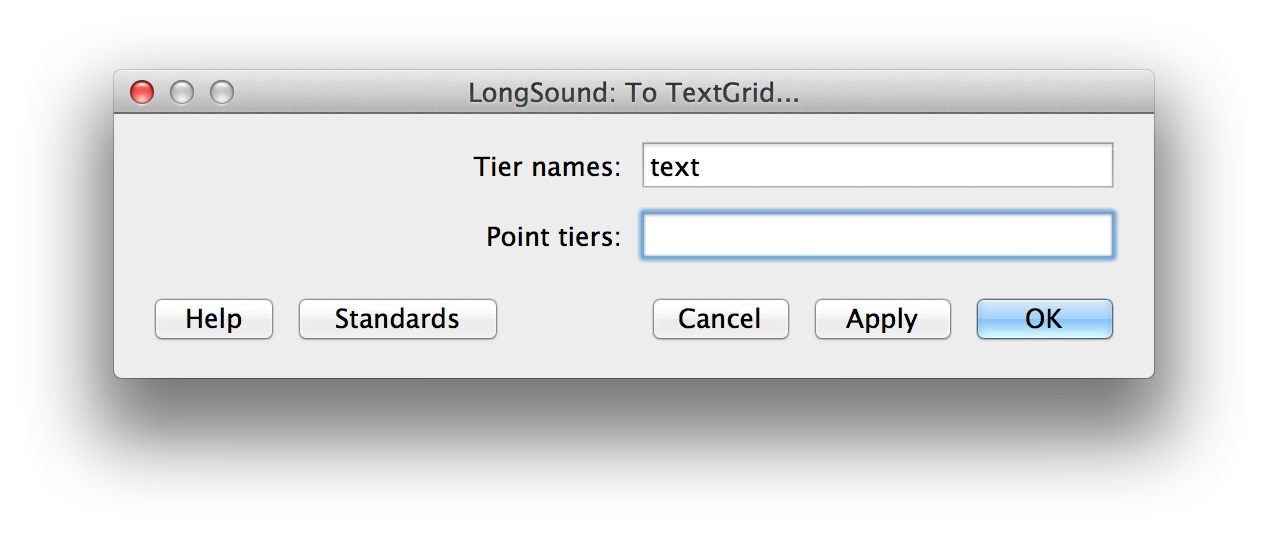
Click to create the TextGrid, which will show in the Praat object window.
-
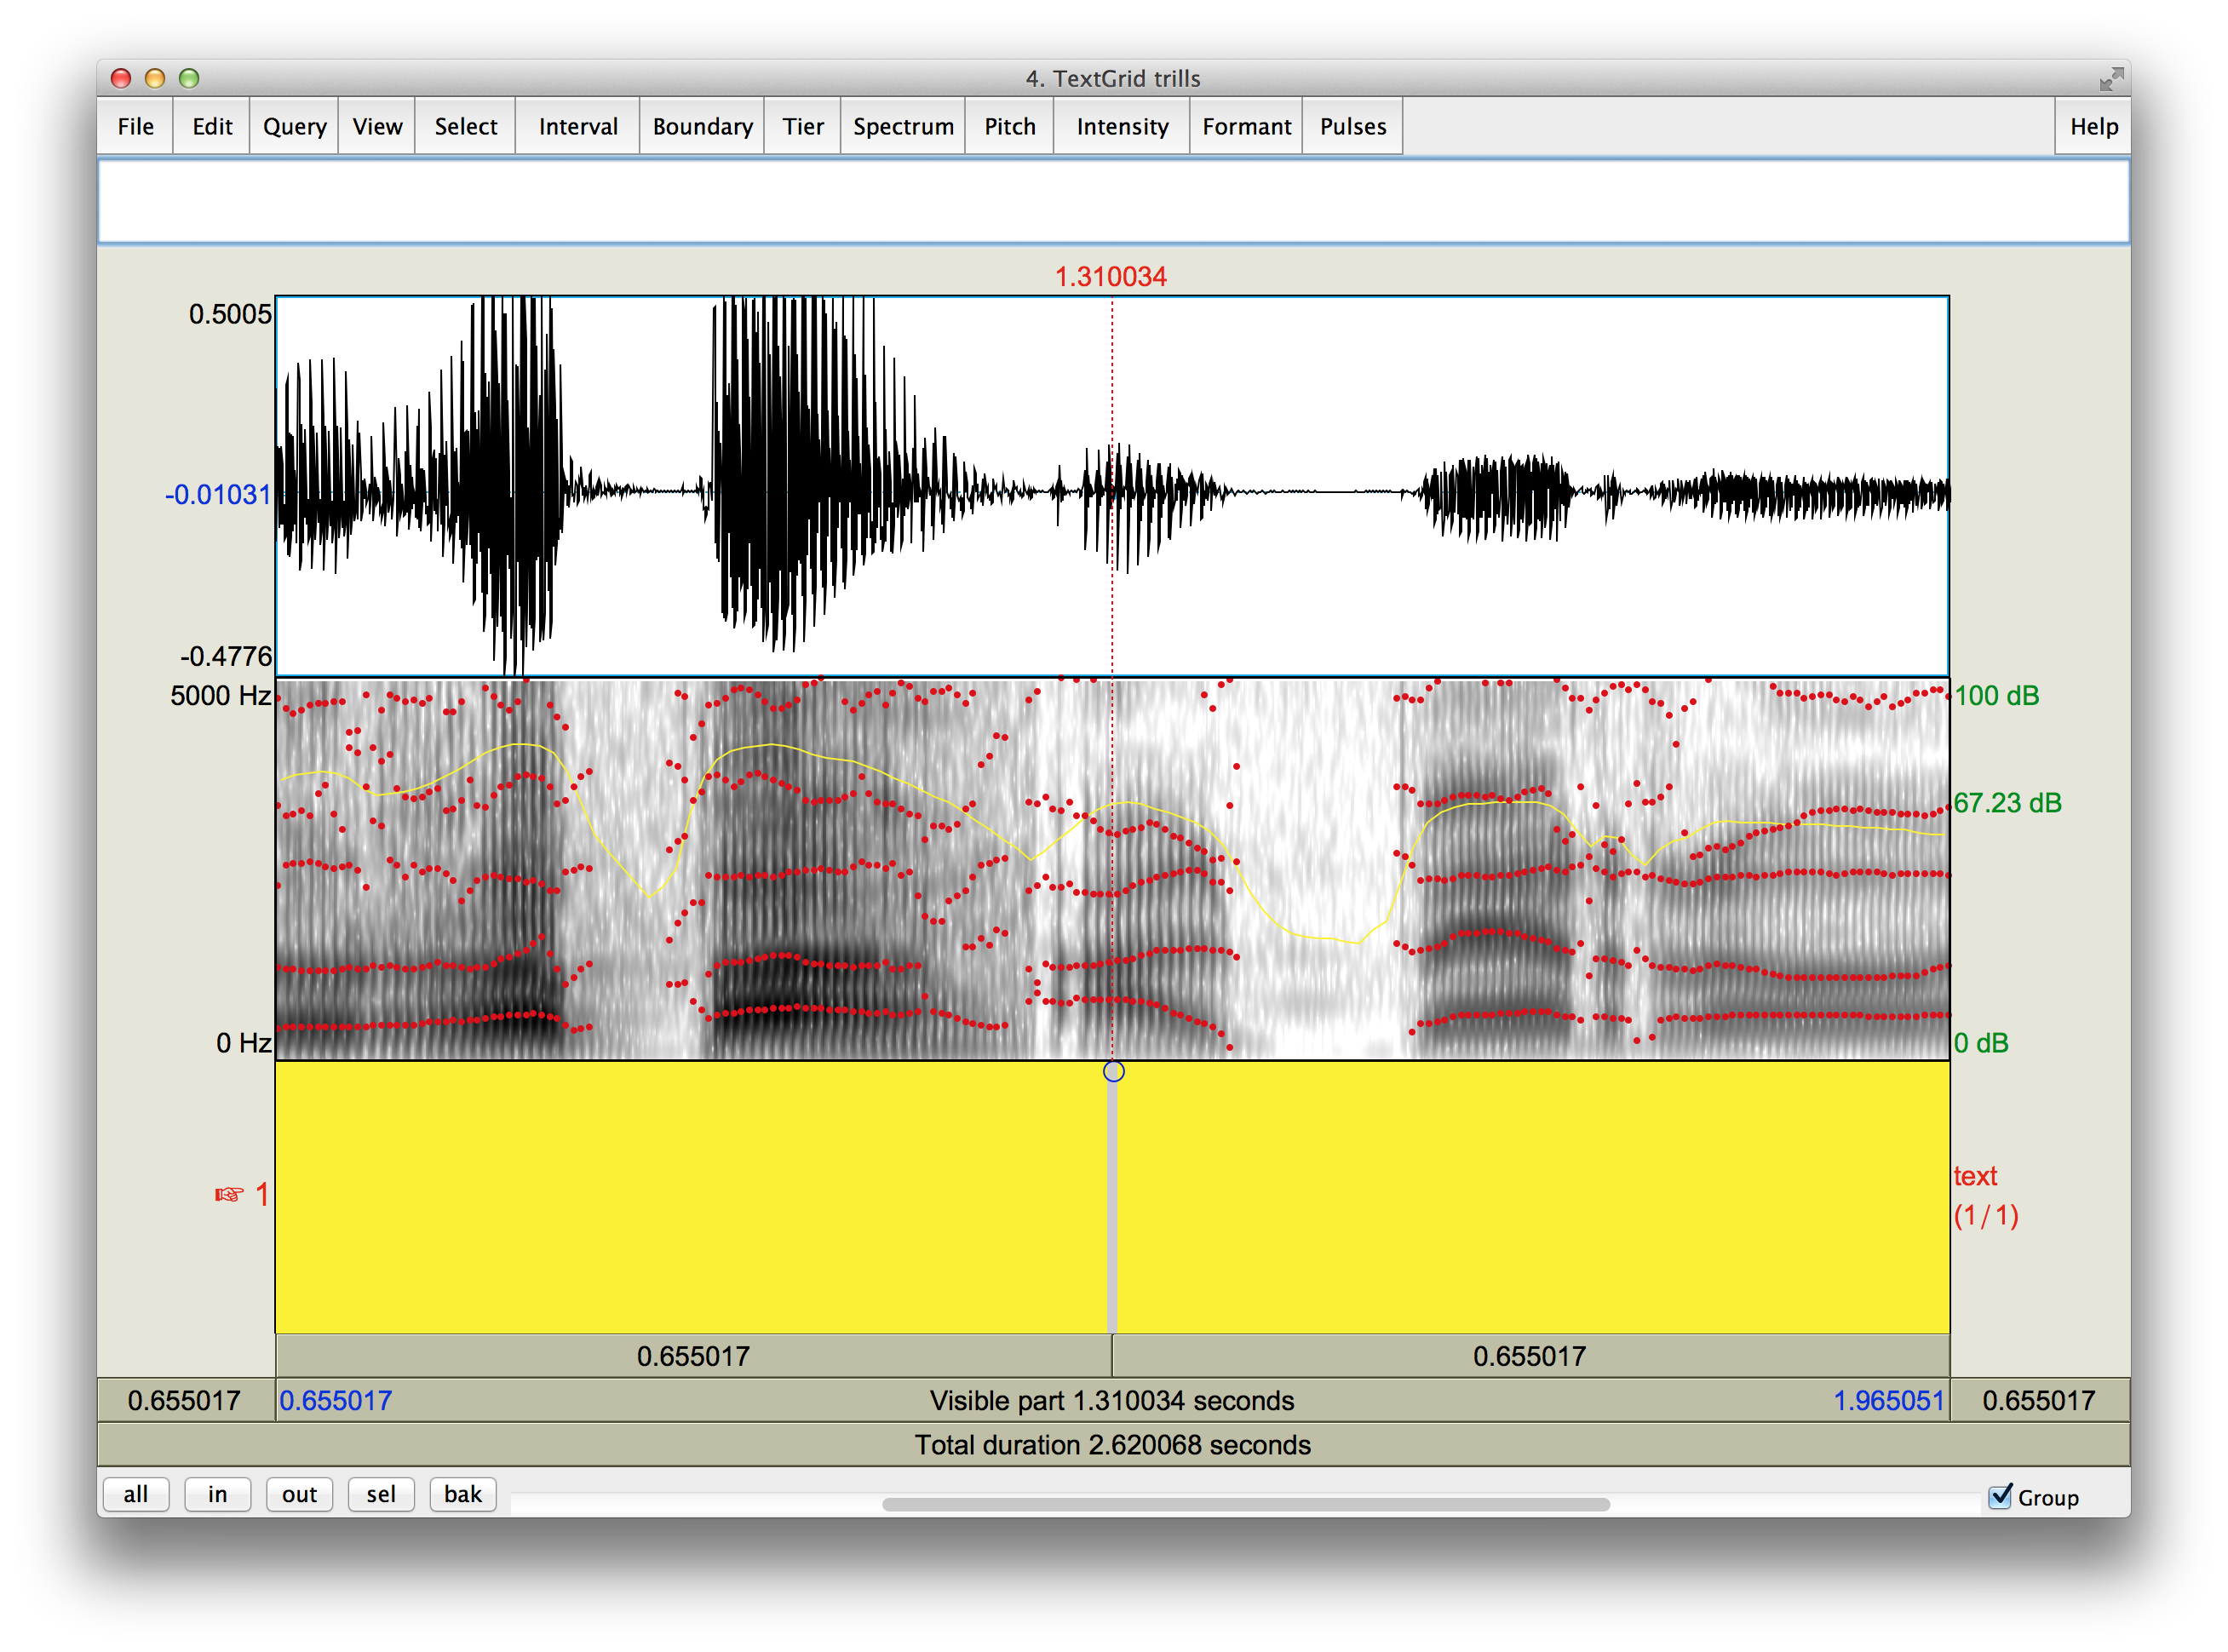
Select both Long sound file and TextGrid by holding Shift and click to open them in the same window.
-
A window will appear. You will see the waveform of the sound on top, the spectrogram in the middle, the tier of the just-created TextGrid on the bottom:
-
To label a trill, create an interval. Click on the start of the interval in the waveform or spectrogram region and press Enter to add a left boundary. Click on the end of the interval and press Enter to create a left boundary. Click on the interval and press Tab to play it, making sure that you have selected the correct region. Know that you can drag intervals left and right to adjust them and that you can delete a boundary by pressing Option-Delete on Mac or Alt-Delete on Windows.
-
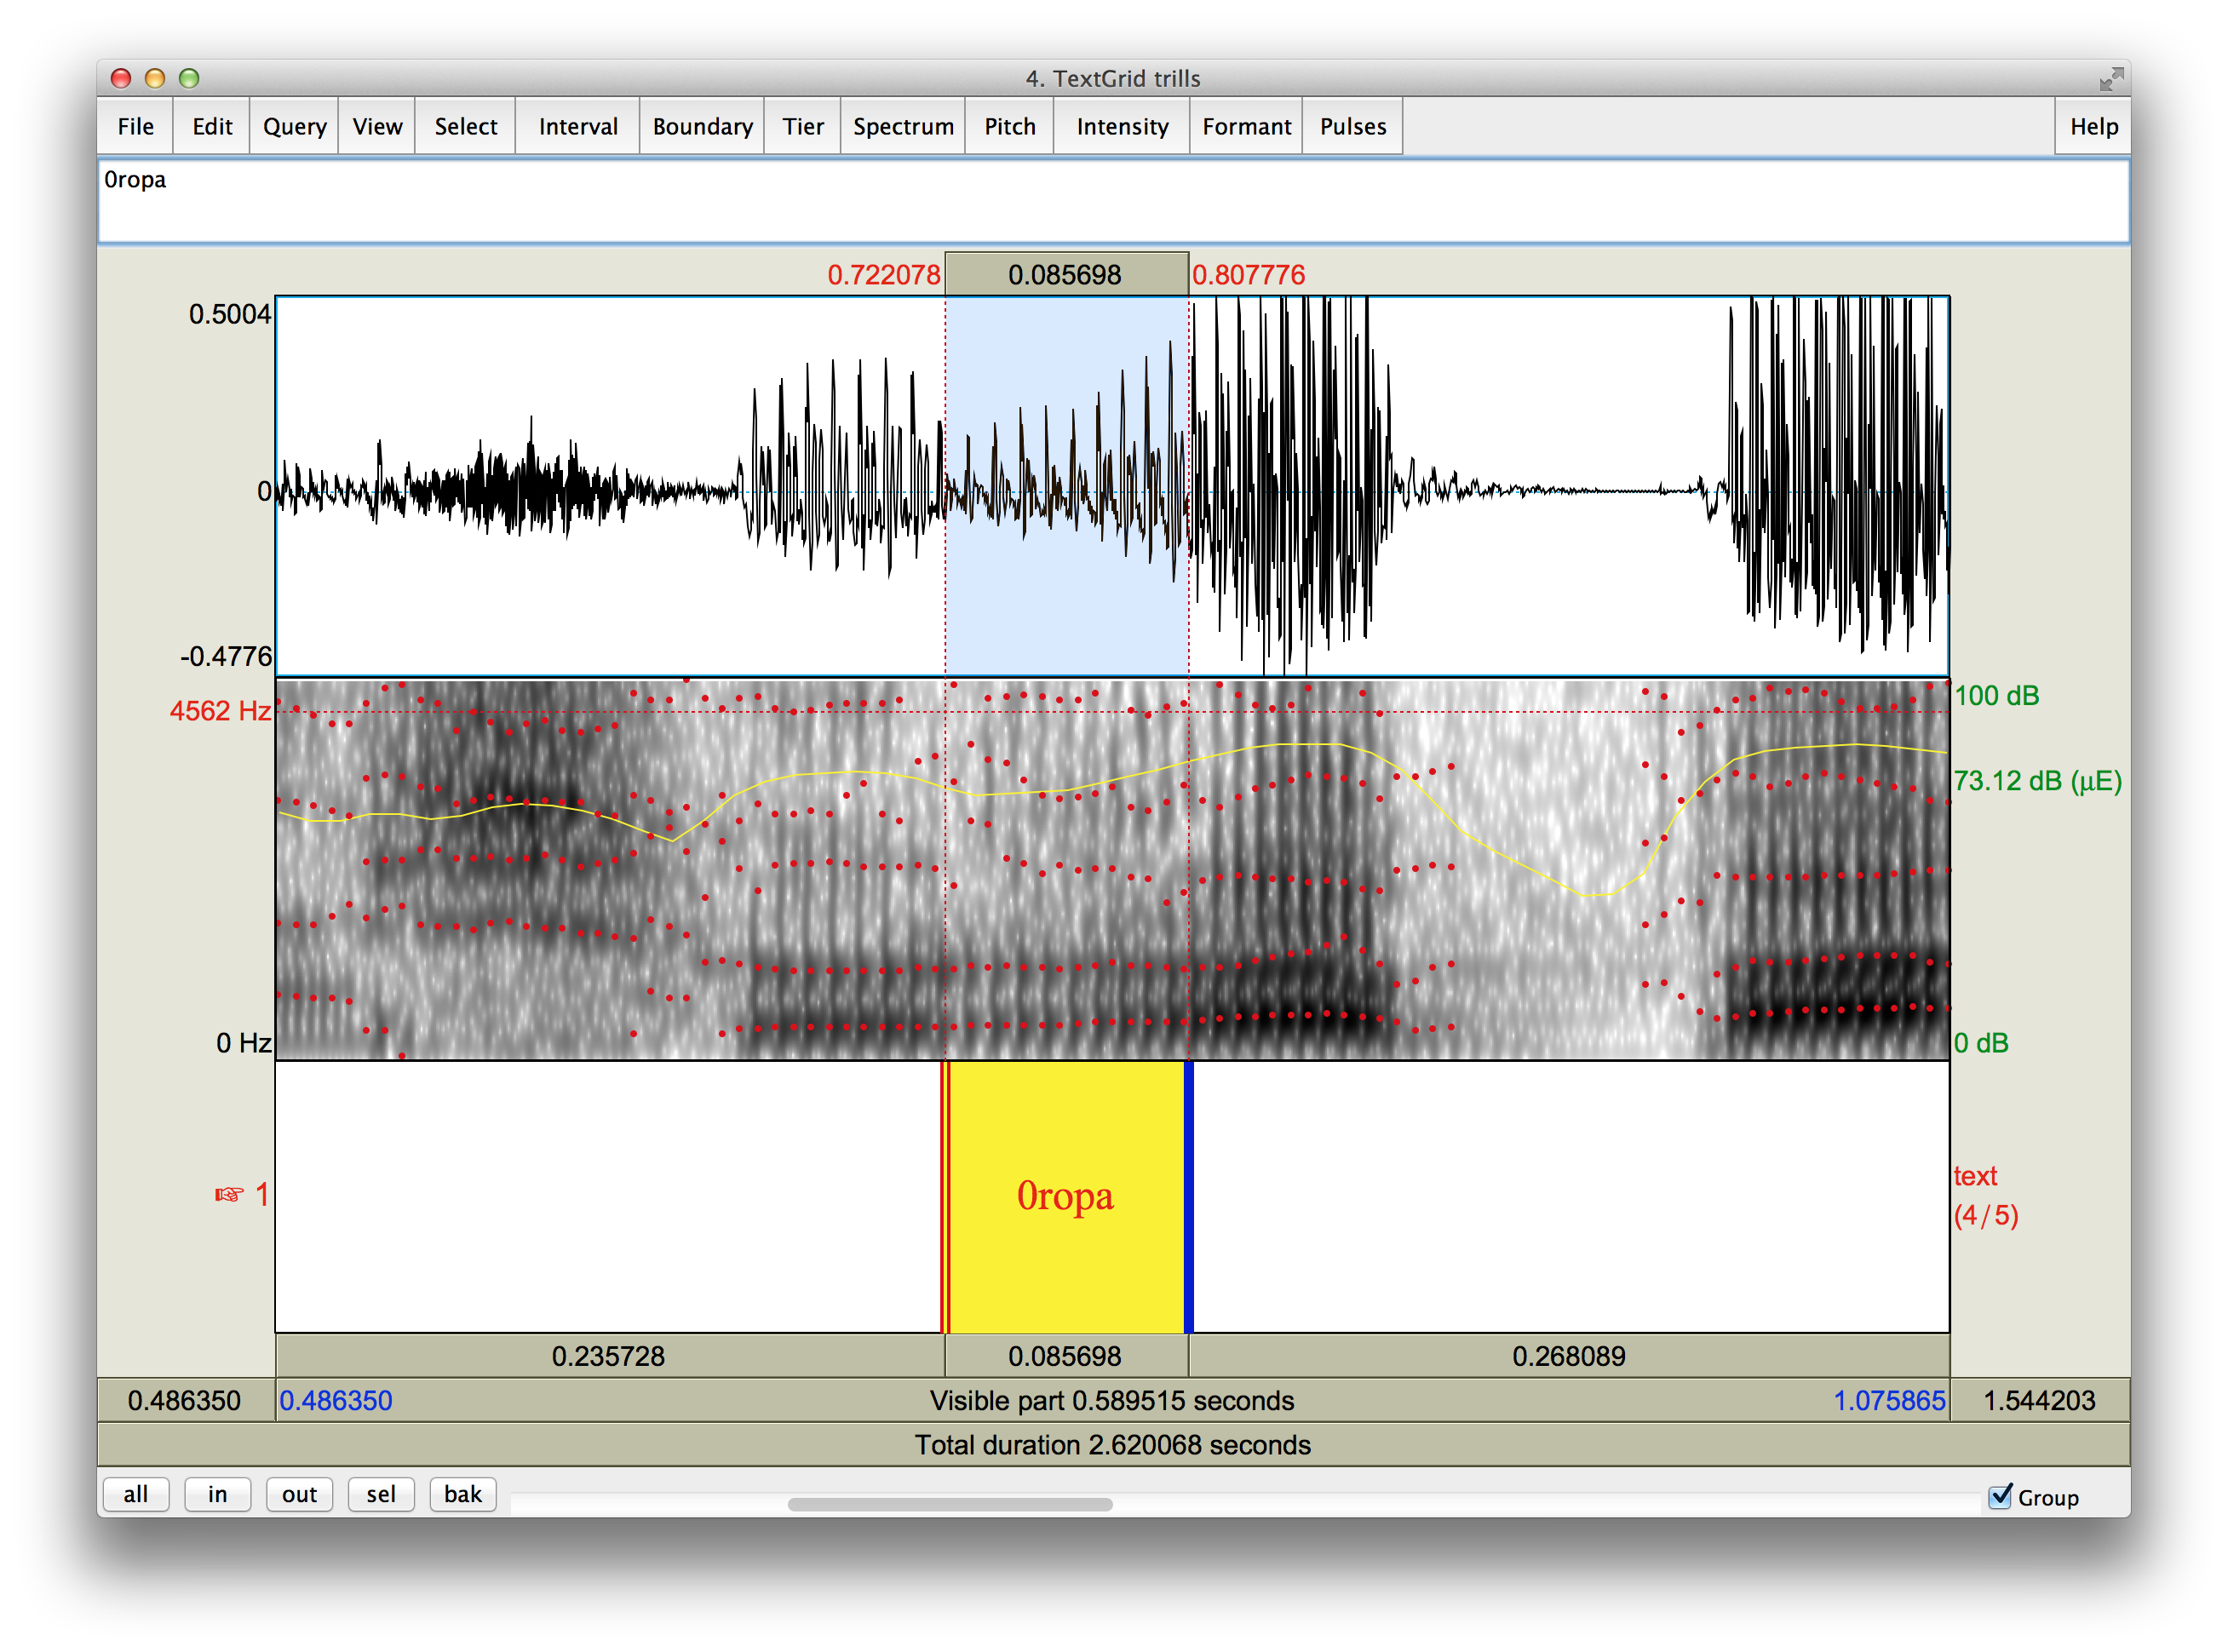
You will need to name intervals that correspond to phonemic trills. The name must begin with the number of occlusions followed by the word. Avoid spaces and accent marks. So if the word were río and the trill had three occlusions, you would have to type 3rio.
Interval names
Be sure to adhere to the naming convention described above and do not include spaces or accent marks in the interval names, as they can lead to unexpected behavior of the script that you will use later.
-
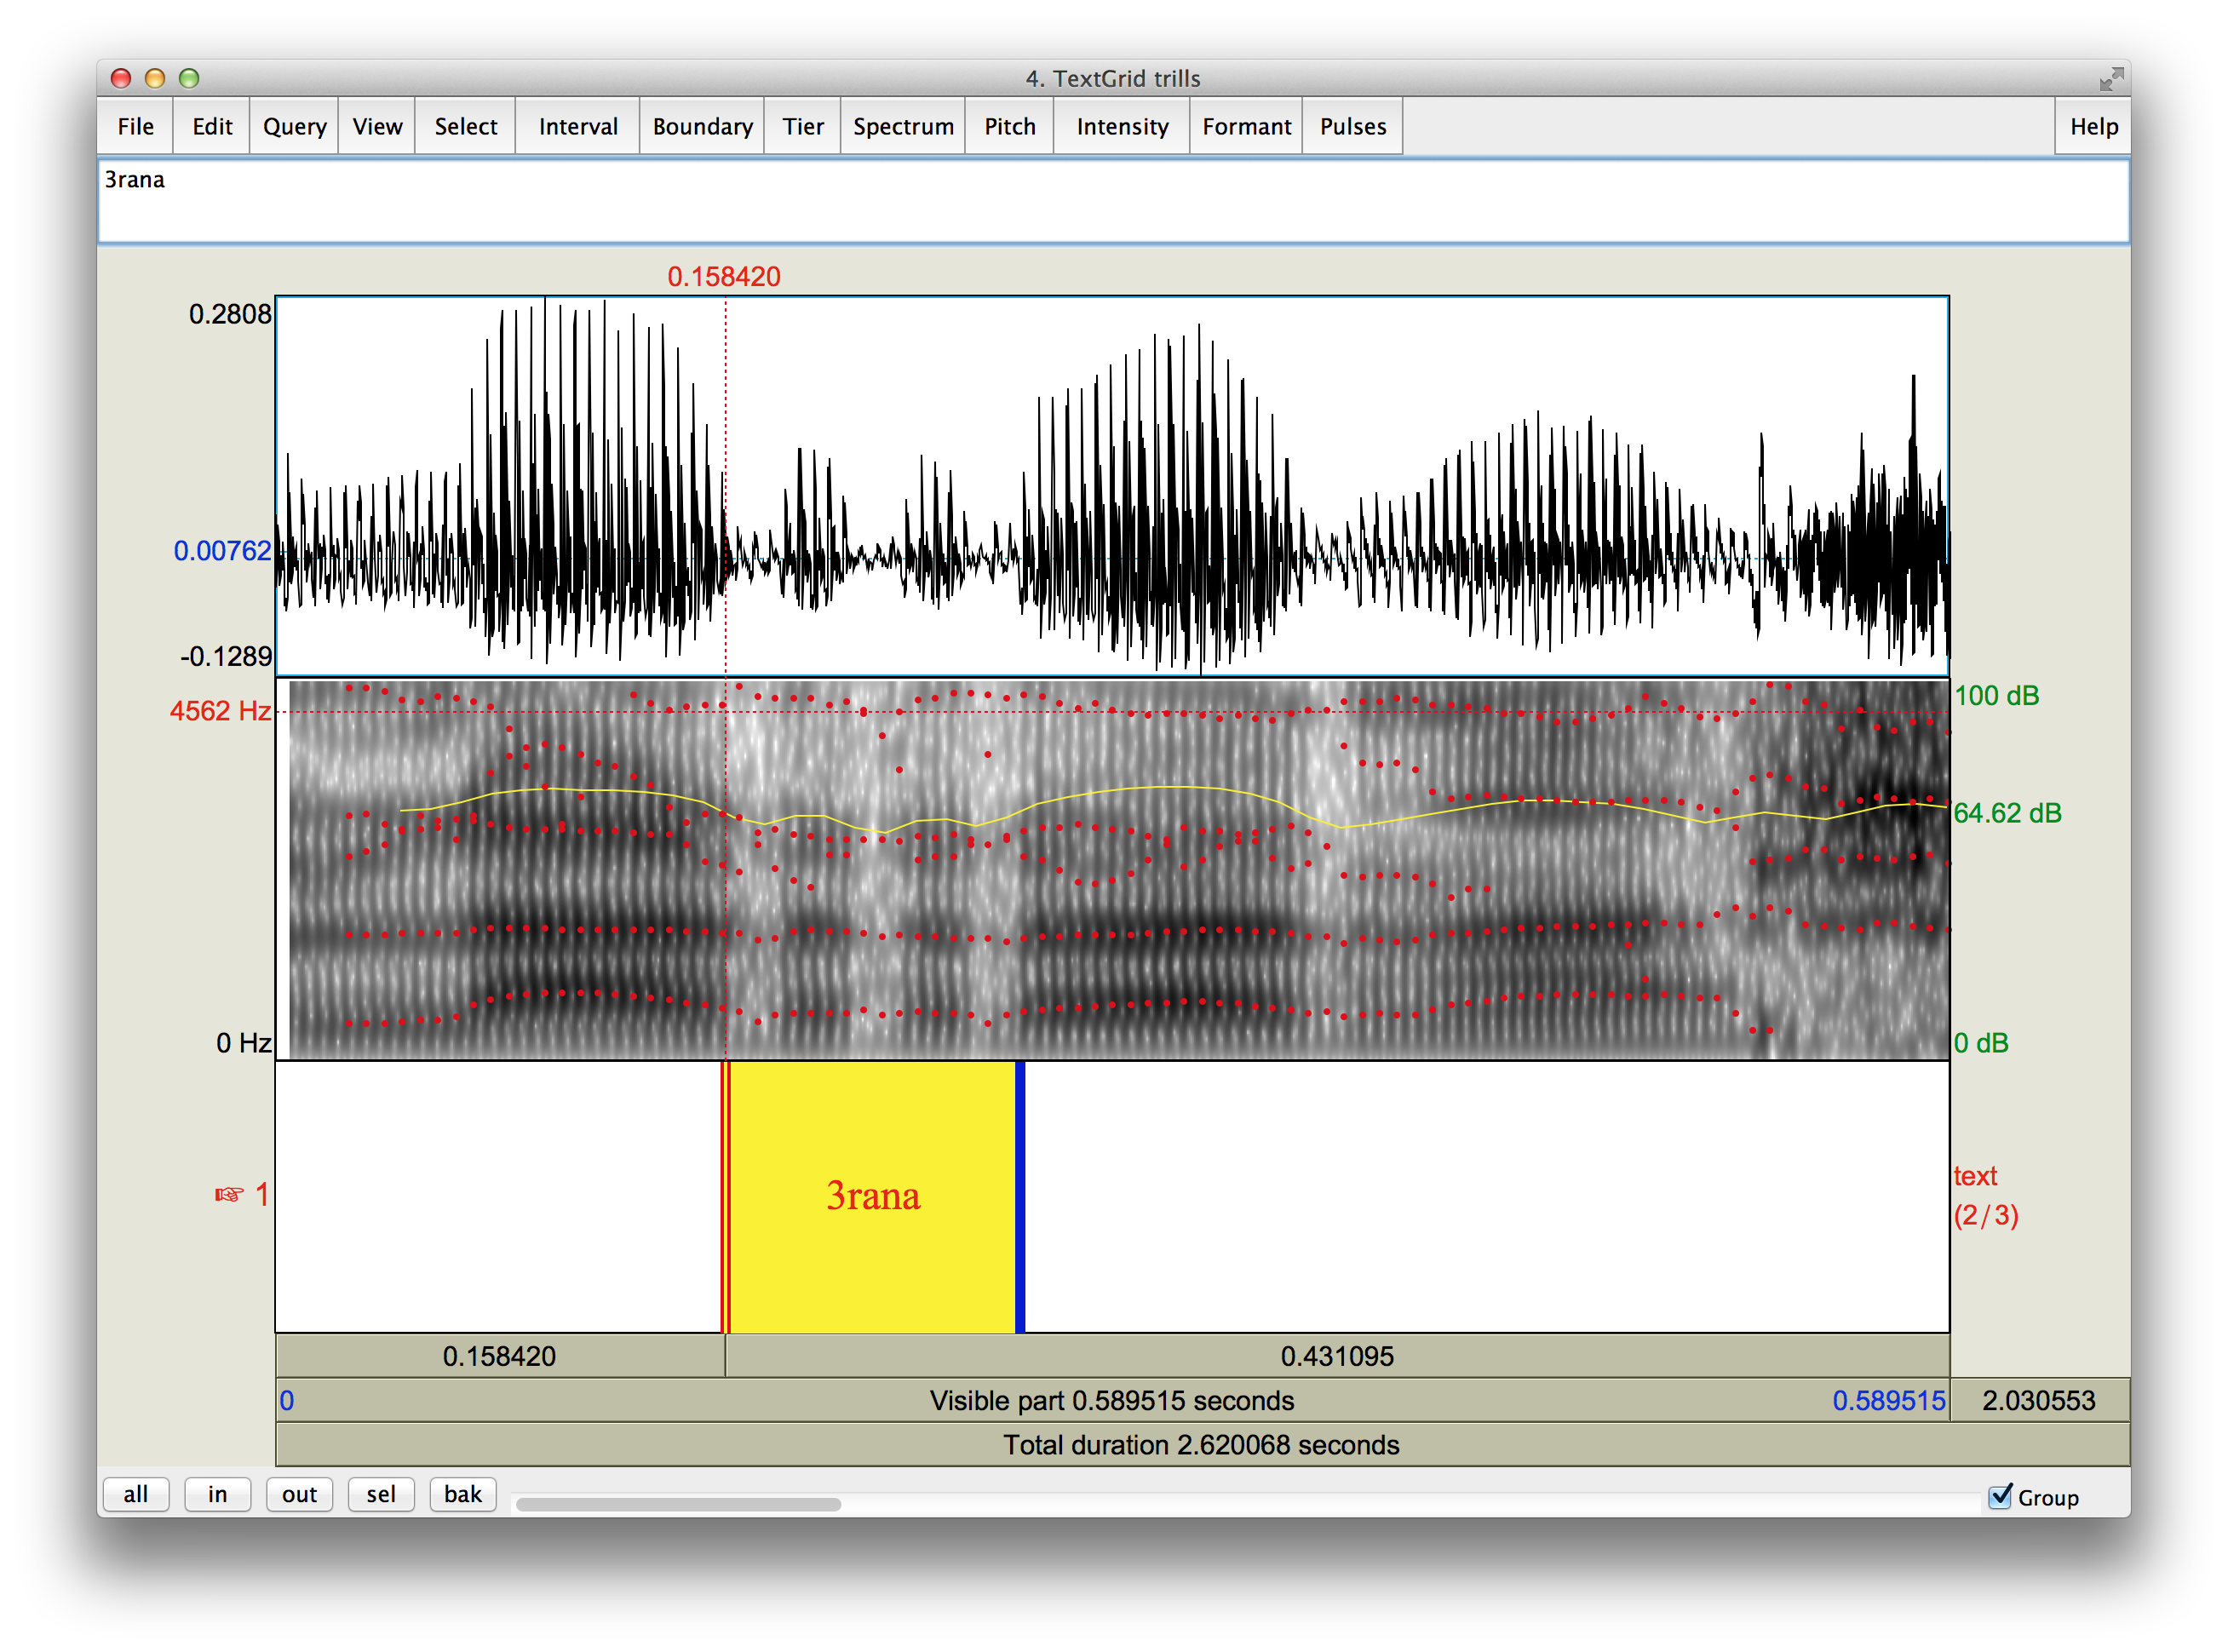
Each phonemic trill that you'll label will most likely have zero to four occlusions. Take advantage of the waveform and spectrogram as you identify them. For instance, each trill will show as a lighter region on the spectrogram.
Here is an example of zero occlusions:
One occlusion:
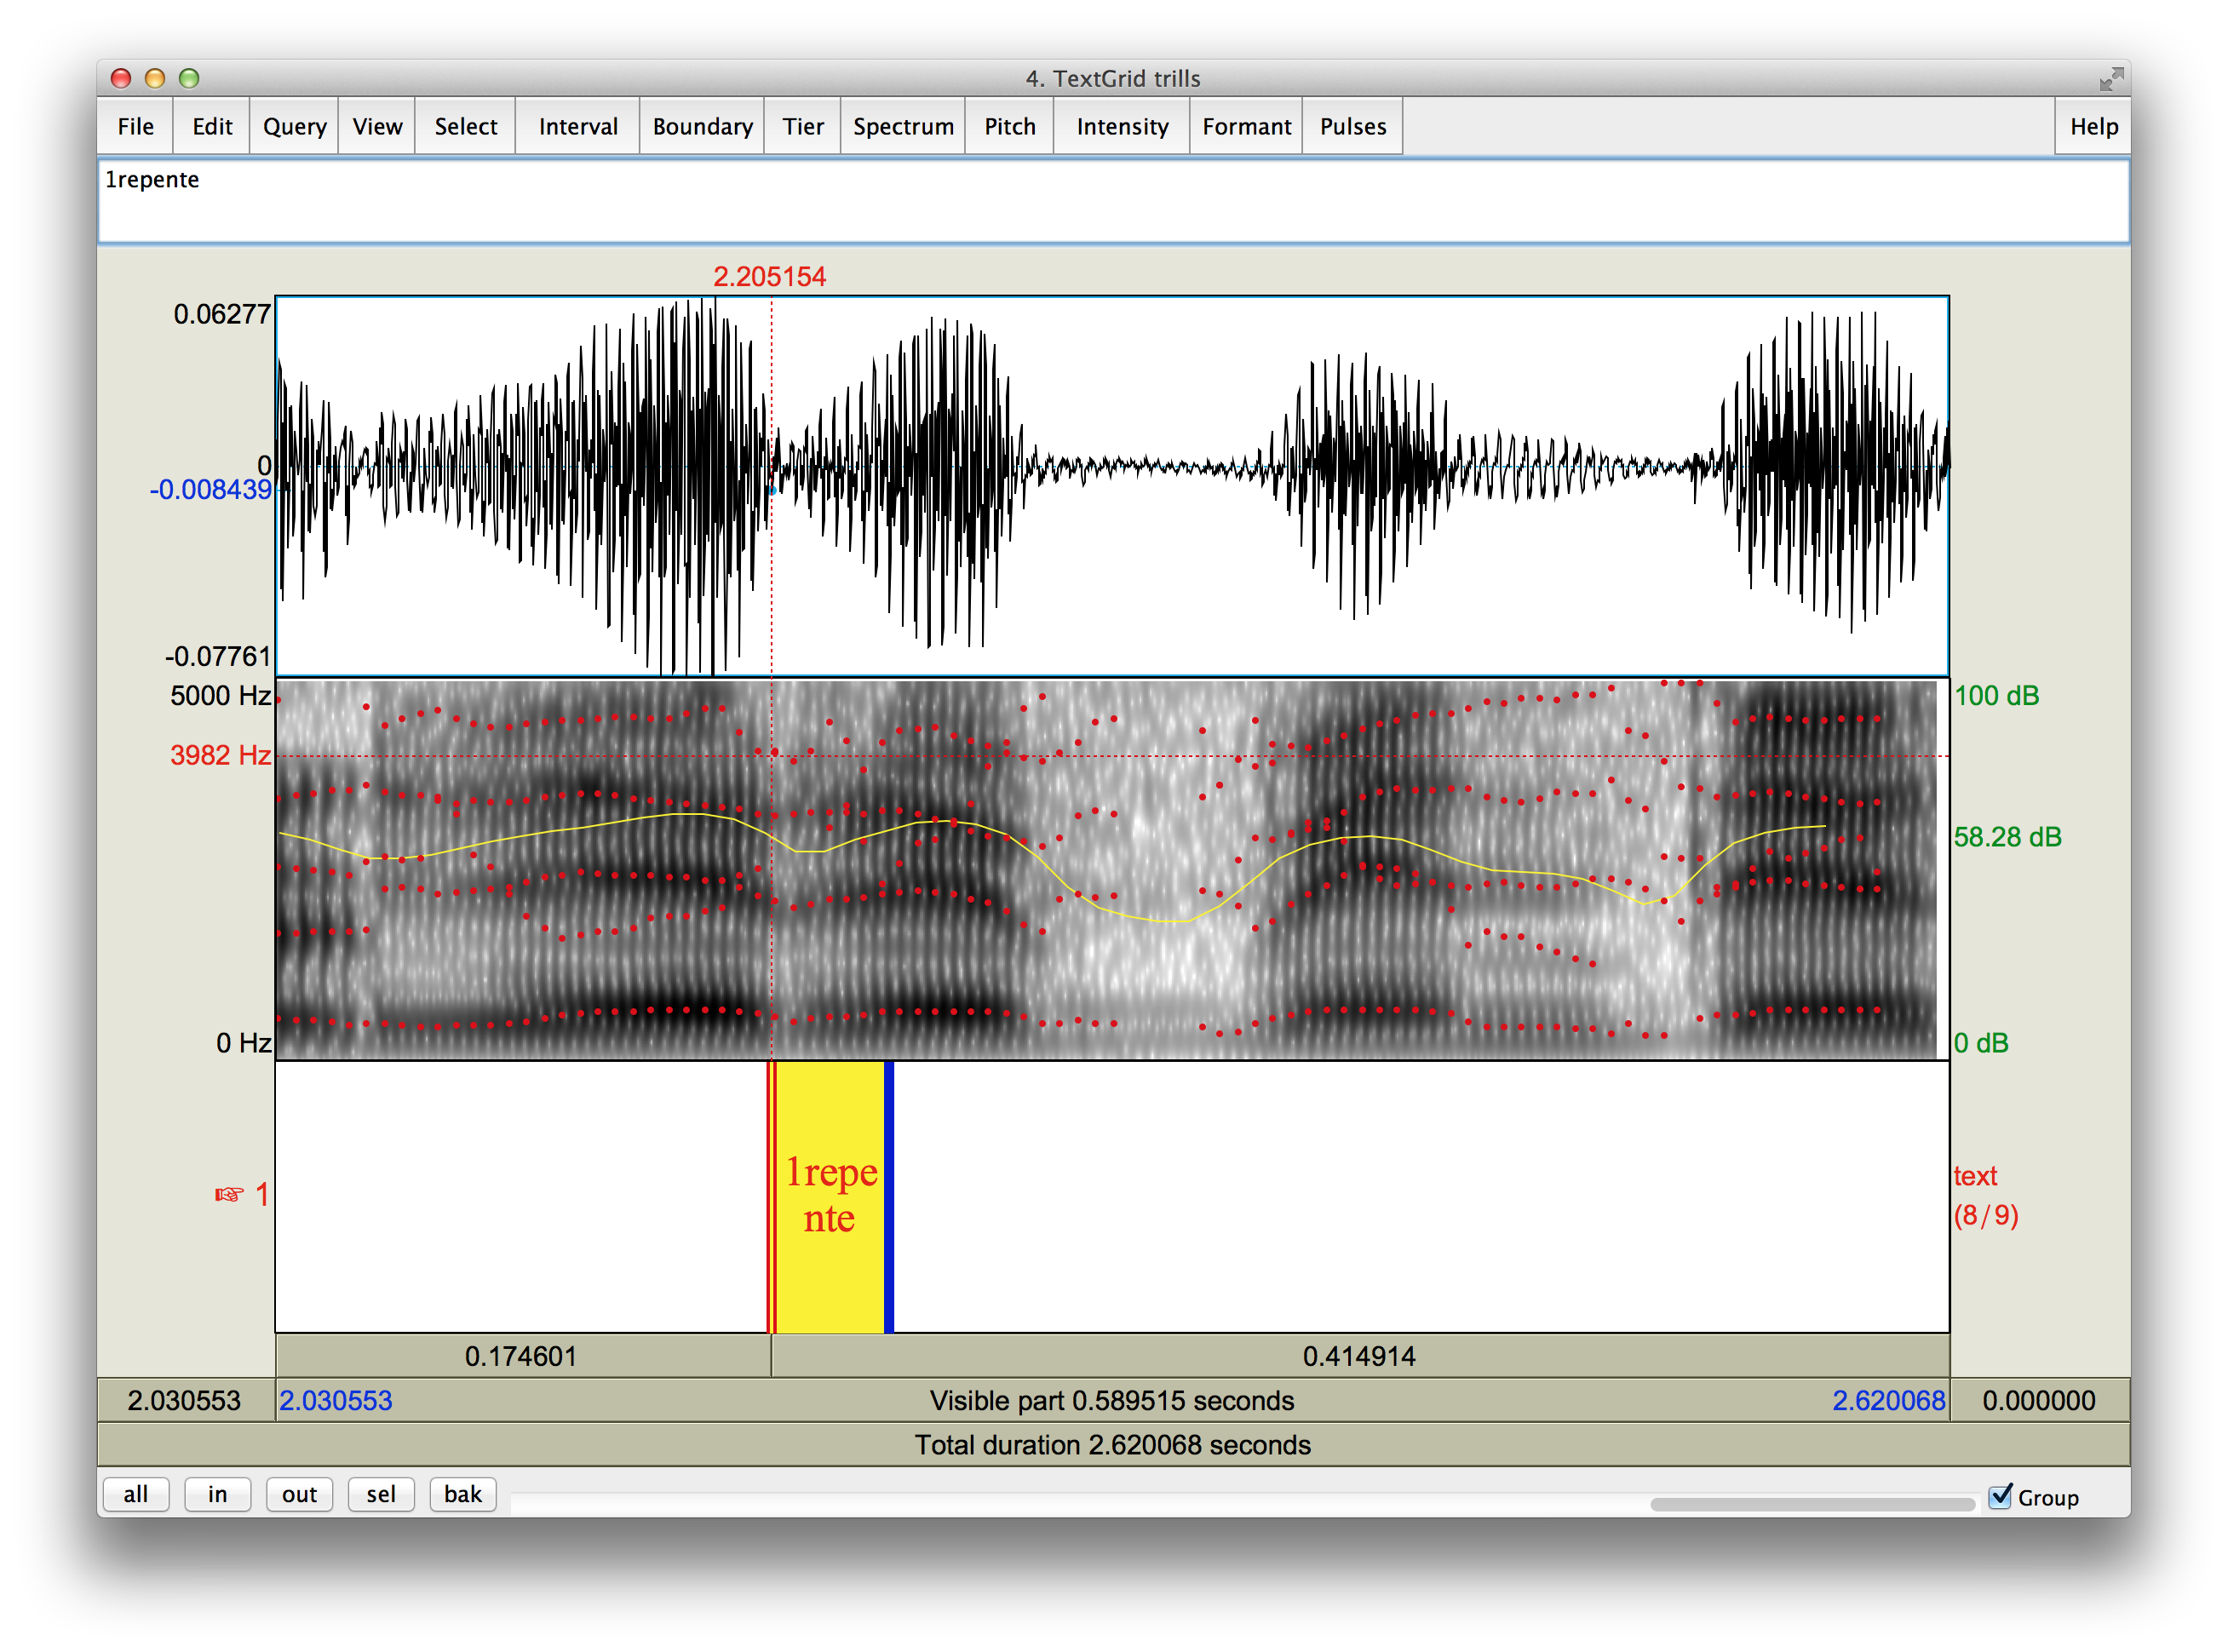
Some two occlusions:
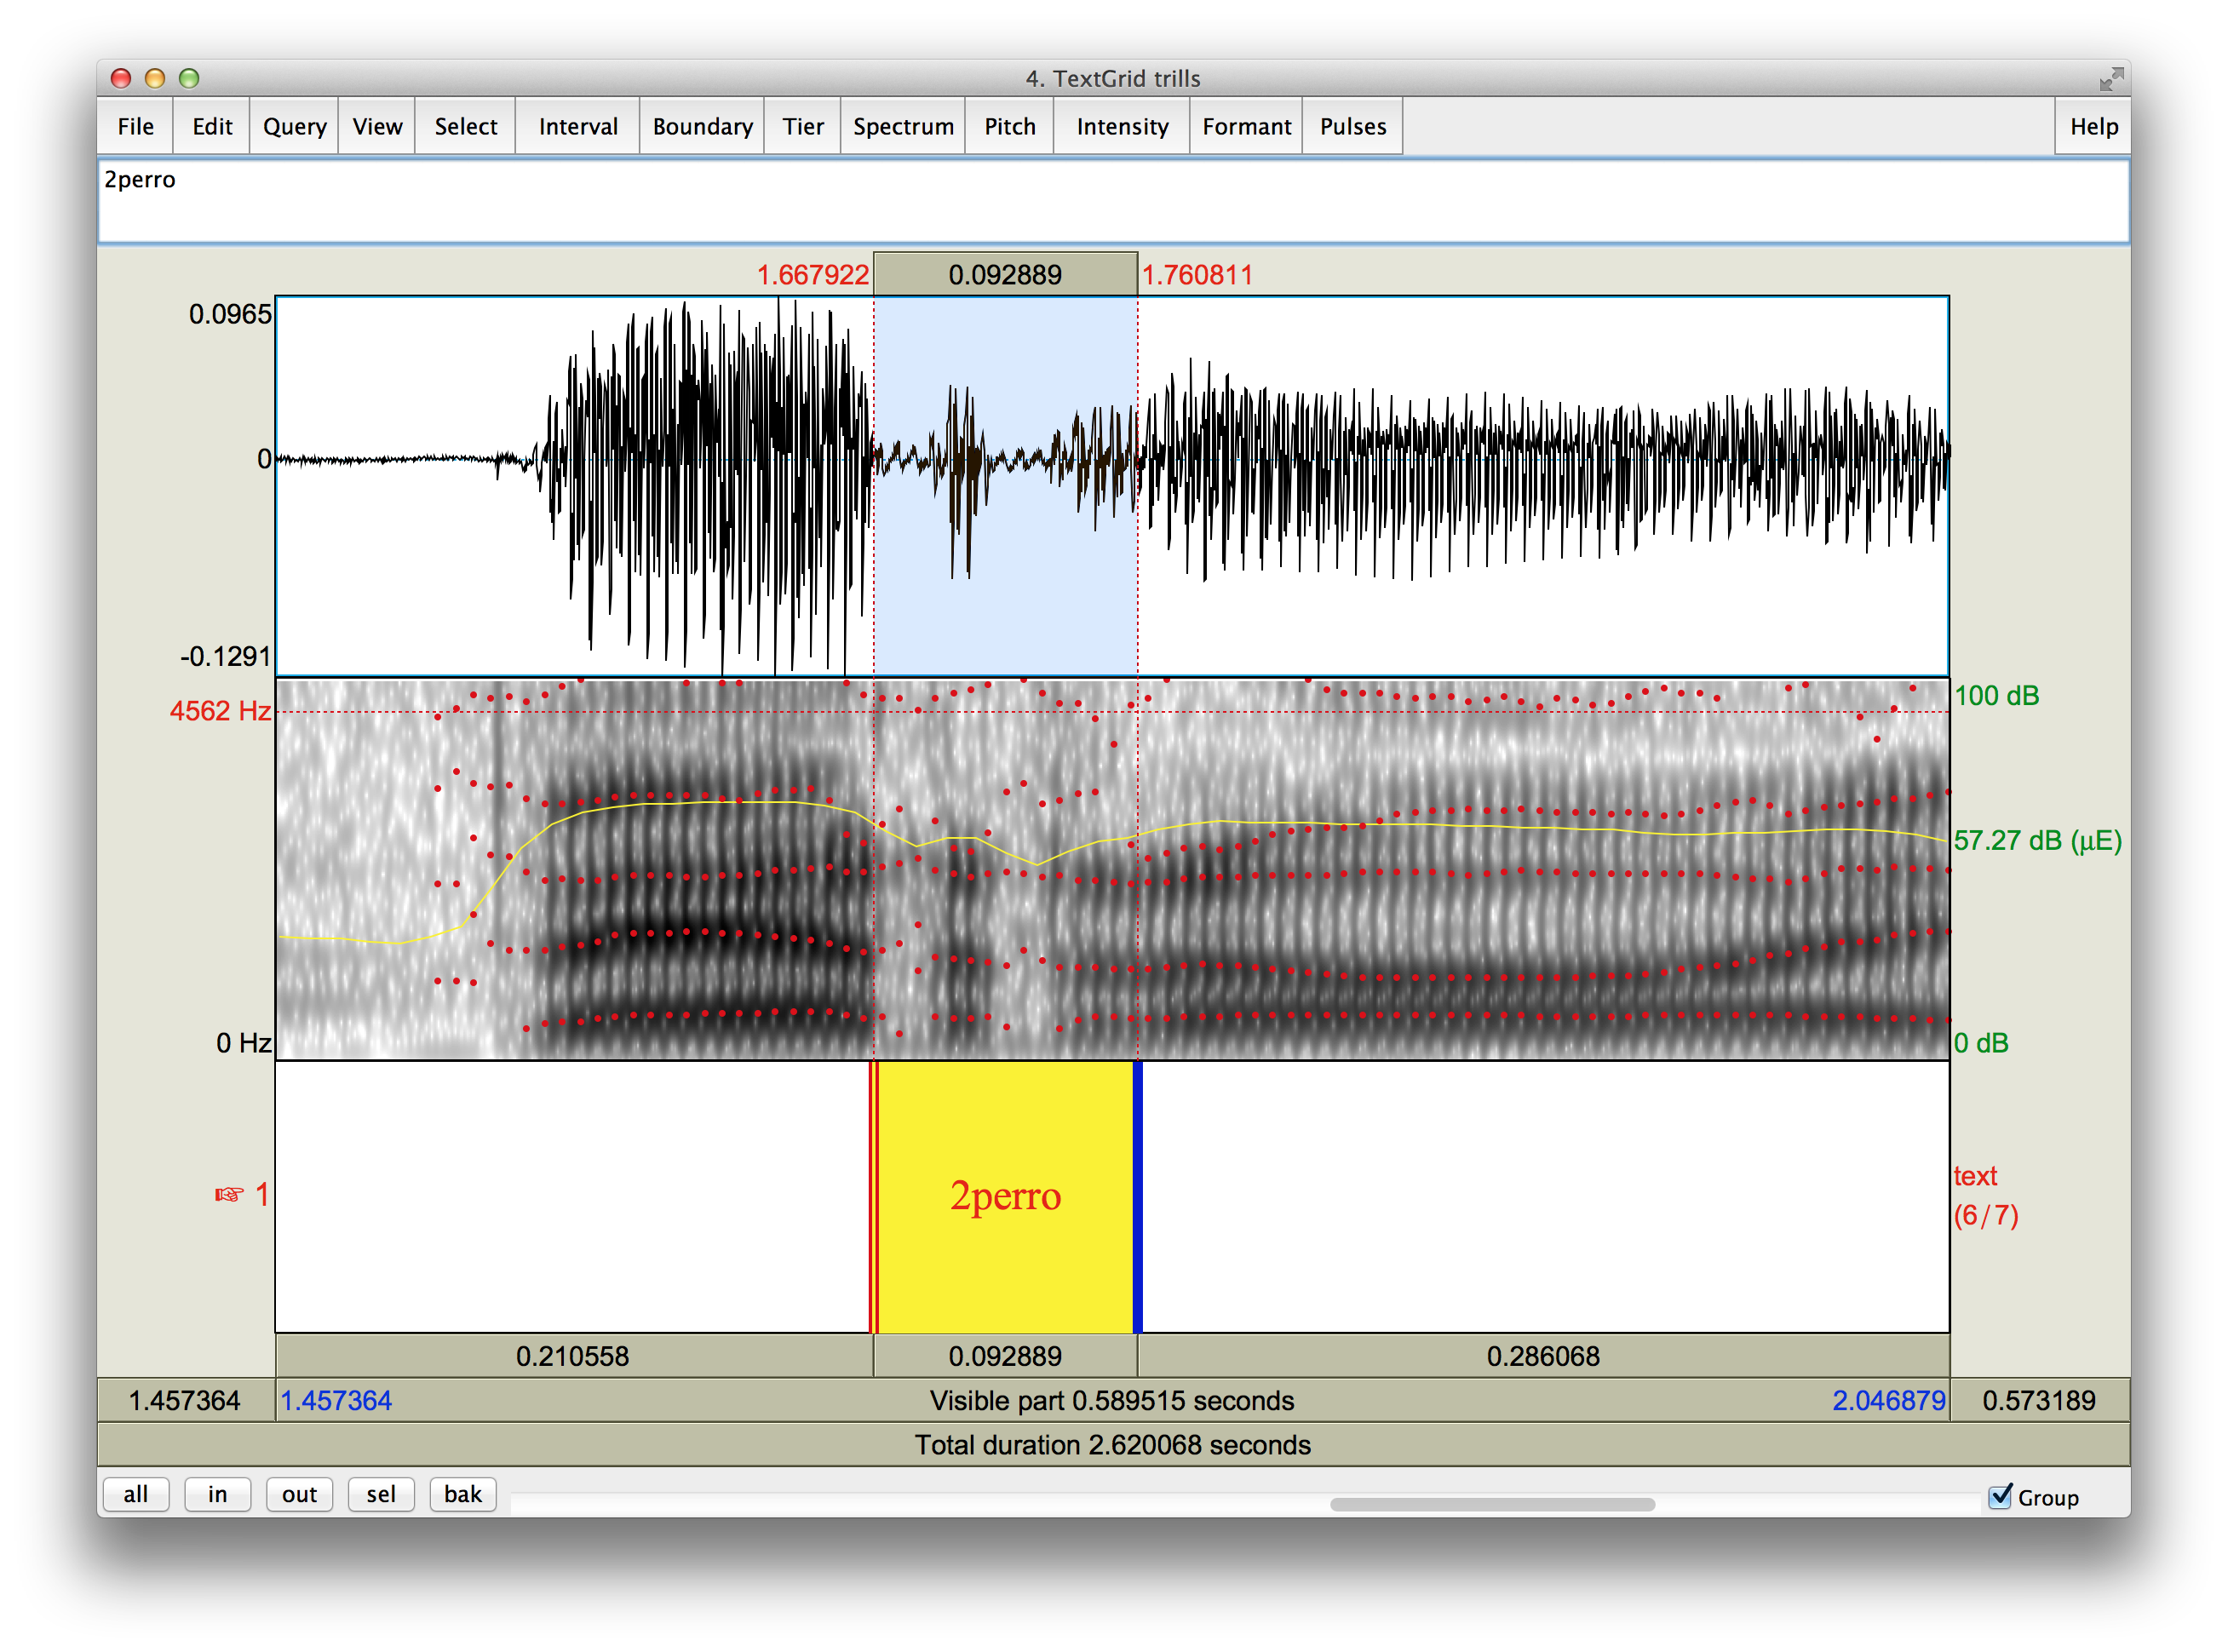
And three occlusions:
-
And remember the following shortcuts when working in Praat:
Action Mac Windows Zoom in Command-I Control-I Zoom out Command-O Control-O Zoom to selection Command-N Control-N Zoom all Command-A Control-A Play or stop Tab Tab Delete a boundary Option-Delete Alt-Delete Undo Command-Z Control-Z -
And if you are using a Mac with a trackpad, take advantage of multi-touch gestures! Pinch to zoom and swipe with to fingers to scroll.
-
Go ahead and start labeling phonemic trills! Again, be sure to correctly name the intervals.
-
Once finished, don't forget to save the TextGrid. Click File and then Save TextGrid as text file…. Be sure that you are in your project folder and that the names of the sound file and the TextGrid match, and click .
-
Now open the second sound file and label all the phonemic trills therein. Save the TextGrid.
Script
-
Let's use a script to ask Praat to extract the durations of the trills that you have labeled in the two sound files. Thanks to the way you named the intervals, Praat will also provide the number of occlusions and the word.
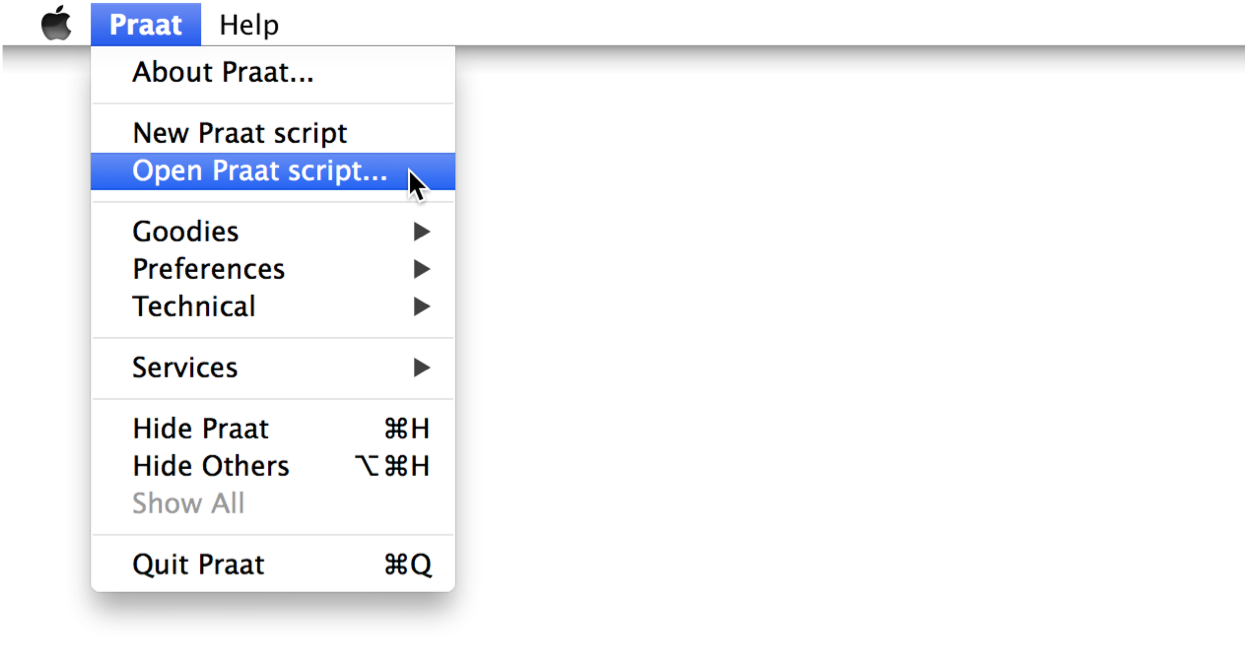
Double-click on occlusions.praat to open it. Alternatively, click Praat and then Open Praat script… in the menu bar. Then navigate to occlusions.praat and click to open.
-
A script editor window should appear. To execute the script, click Run and then Run again.
-
You must first specify the complete path to the folder with the sound files and TextGrids. Note that Praat will analyze all pairs of sound files and TexGrids in that folder, so you only need to run the script once.
File names
Be sure that sound files and TextGrids have the same names (although their extensions will be different) and are located in the same folder.
If your files are in a folder called AD2 on your Desktop, then the path should look something like this if you are on a Windows computer:
And like this if you are using a Mac:
Drag and drop
If you are using a Mac, save some time by dragging your project folder and dropping it into a blank textfield instead of manually typing the directory. Be sure to append a / (forward slash) to specify that the path is to a folder.
-
Next, indicate where you'd like the resulting file to be saved. For simplicity, save it in the same folder as above. You must also provide the name; we suggest you call it results.xls. Make sure that the path to the resulting file looks like this if you are using Windows:
And if you are on a Mac:
-
Click to run the script.
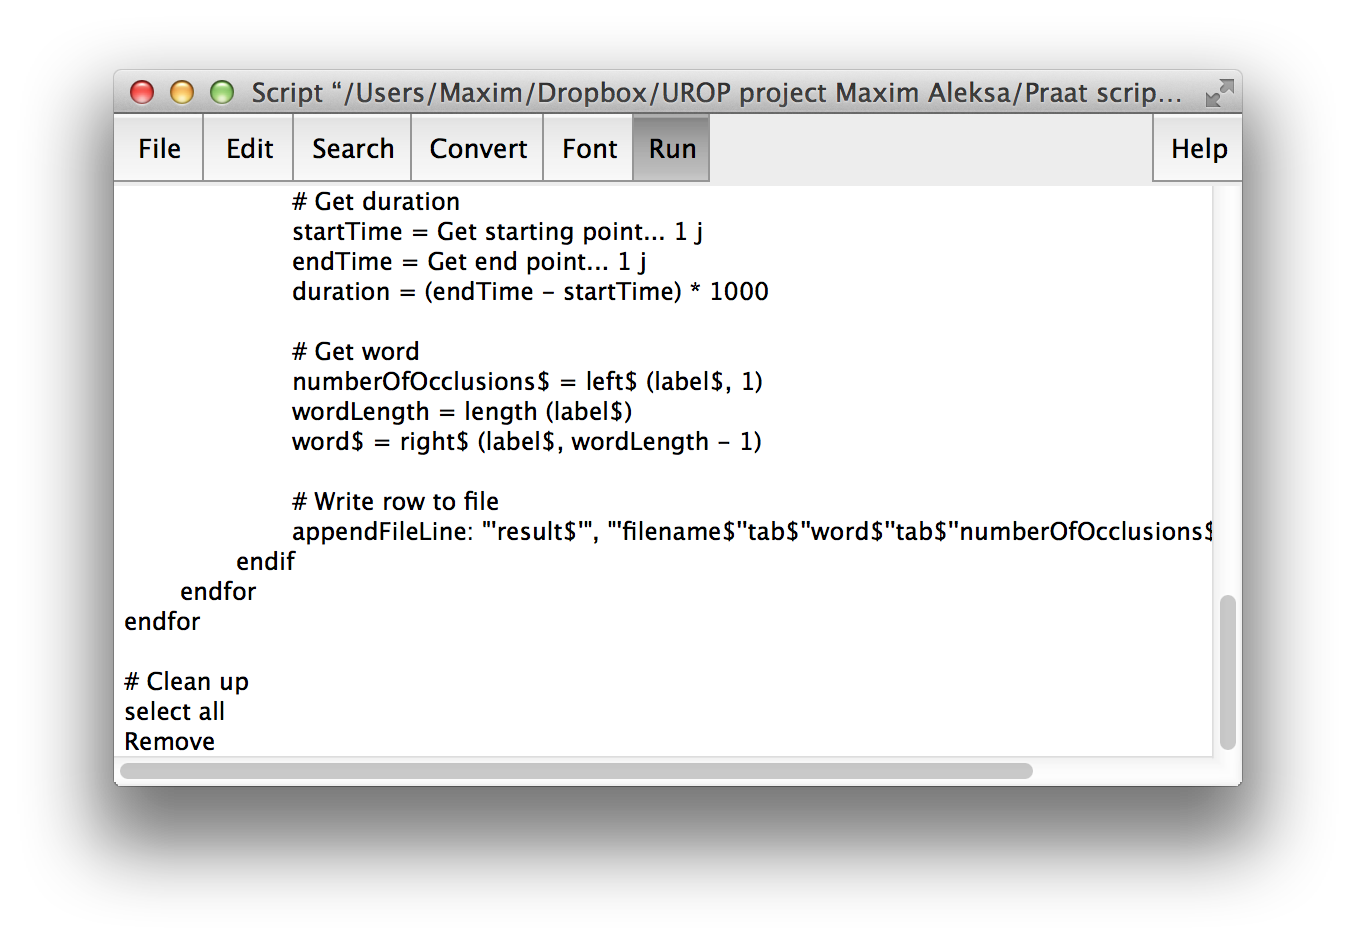
For each interval that you labeled, the script will output the name of the file, the number of occlusions, the word and the duration of the trill in milliseconds.
Underneath the hood
Here is an inside look into how this script has been implemented. It takes the first character of the interval name and assigns that to the number of occlusions. It then removes the first character and obtains the word from the remaining part of the interval name. So the script won't work for a speaker who produces ten or more occlusions!
-
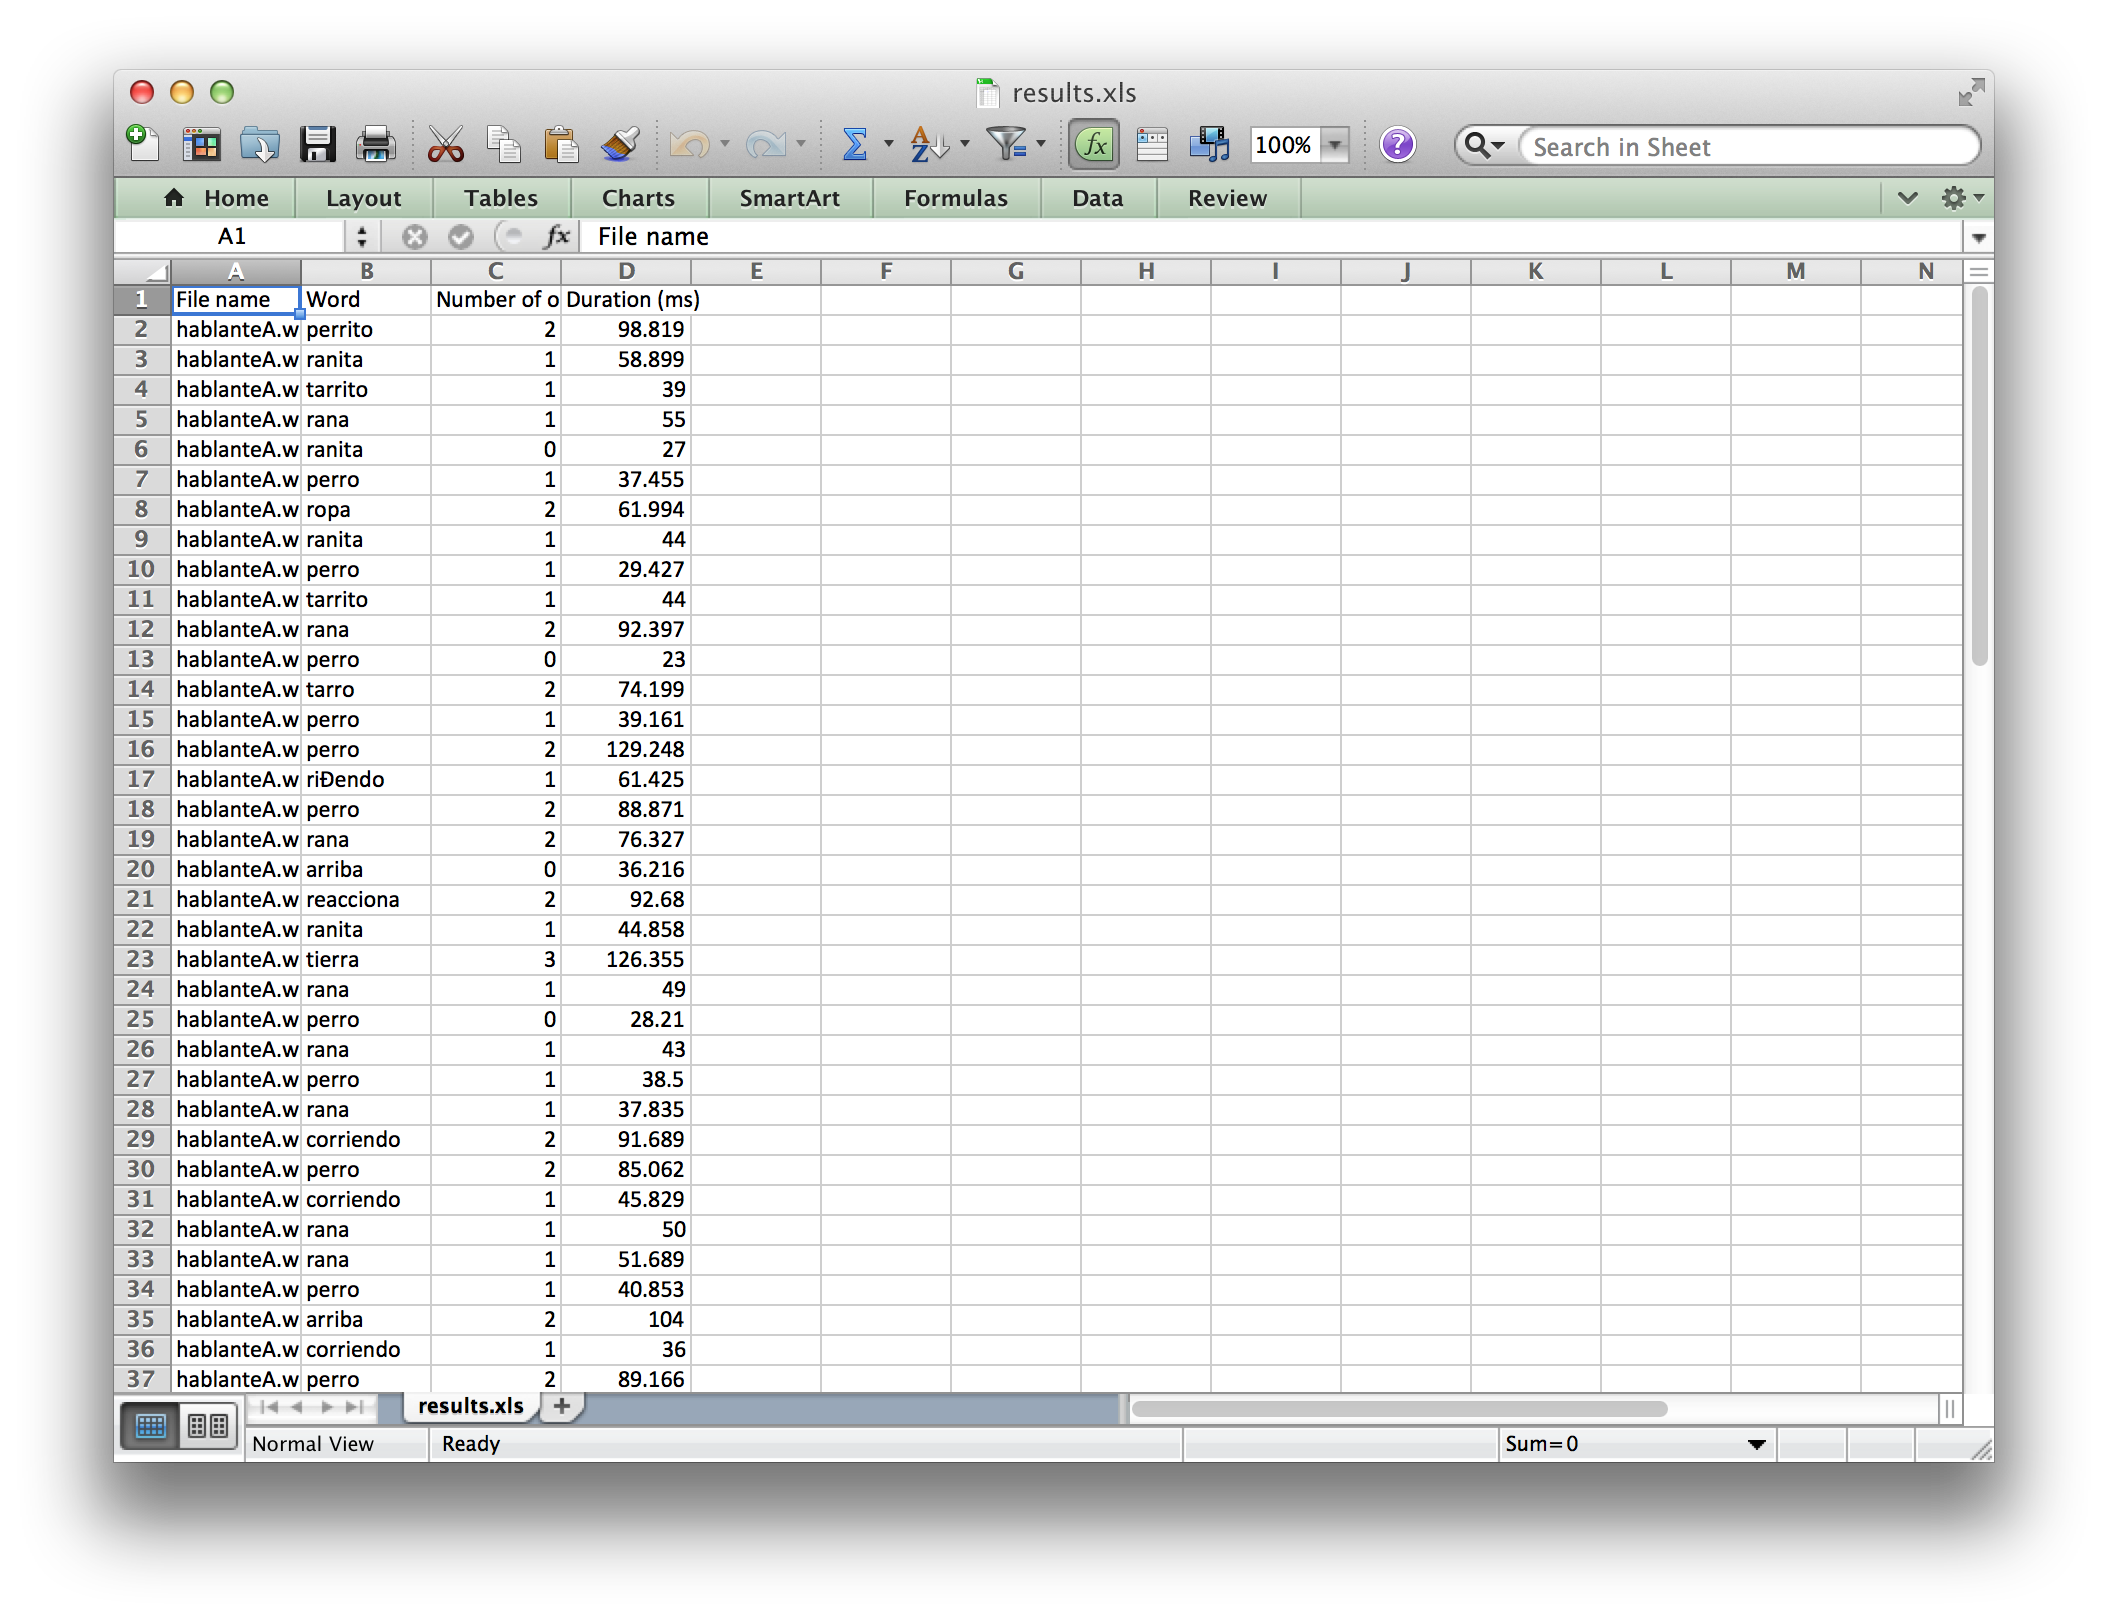
Go to your project folder and open the file created by Praat to check that everything went correctly. You resulting file should resemble the one shown below:
-
If something went wrong and you find yourself lost, turn to this video that illustrates the process of running the script:
Tables and Graphs
-
Let's next take a look at Excel in this video:
Virtual Sites
If you do not have Excel on your computer, know that you can gain access to it via Virtual Sites.
-
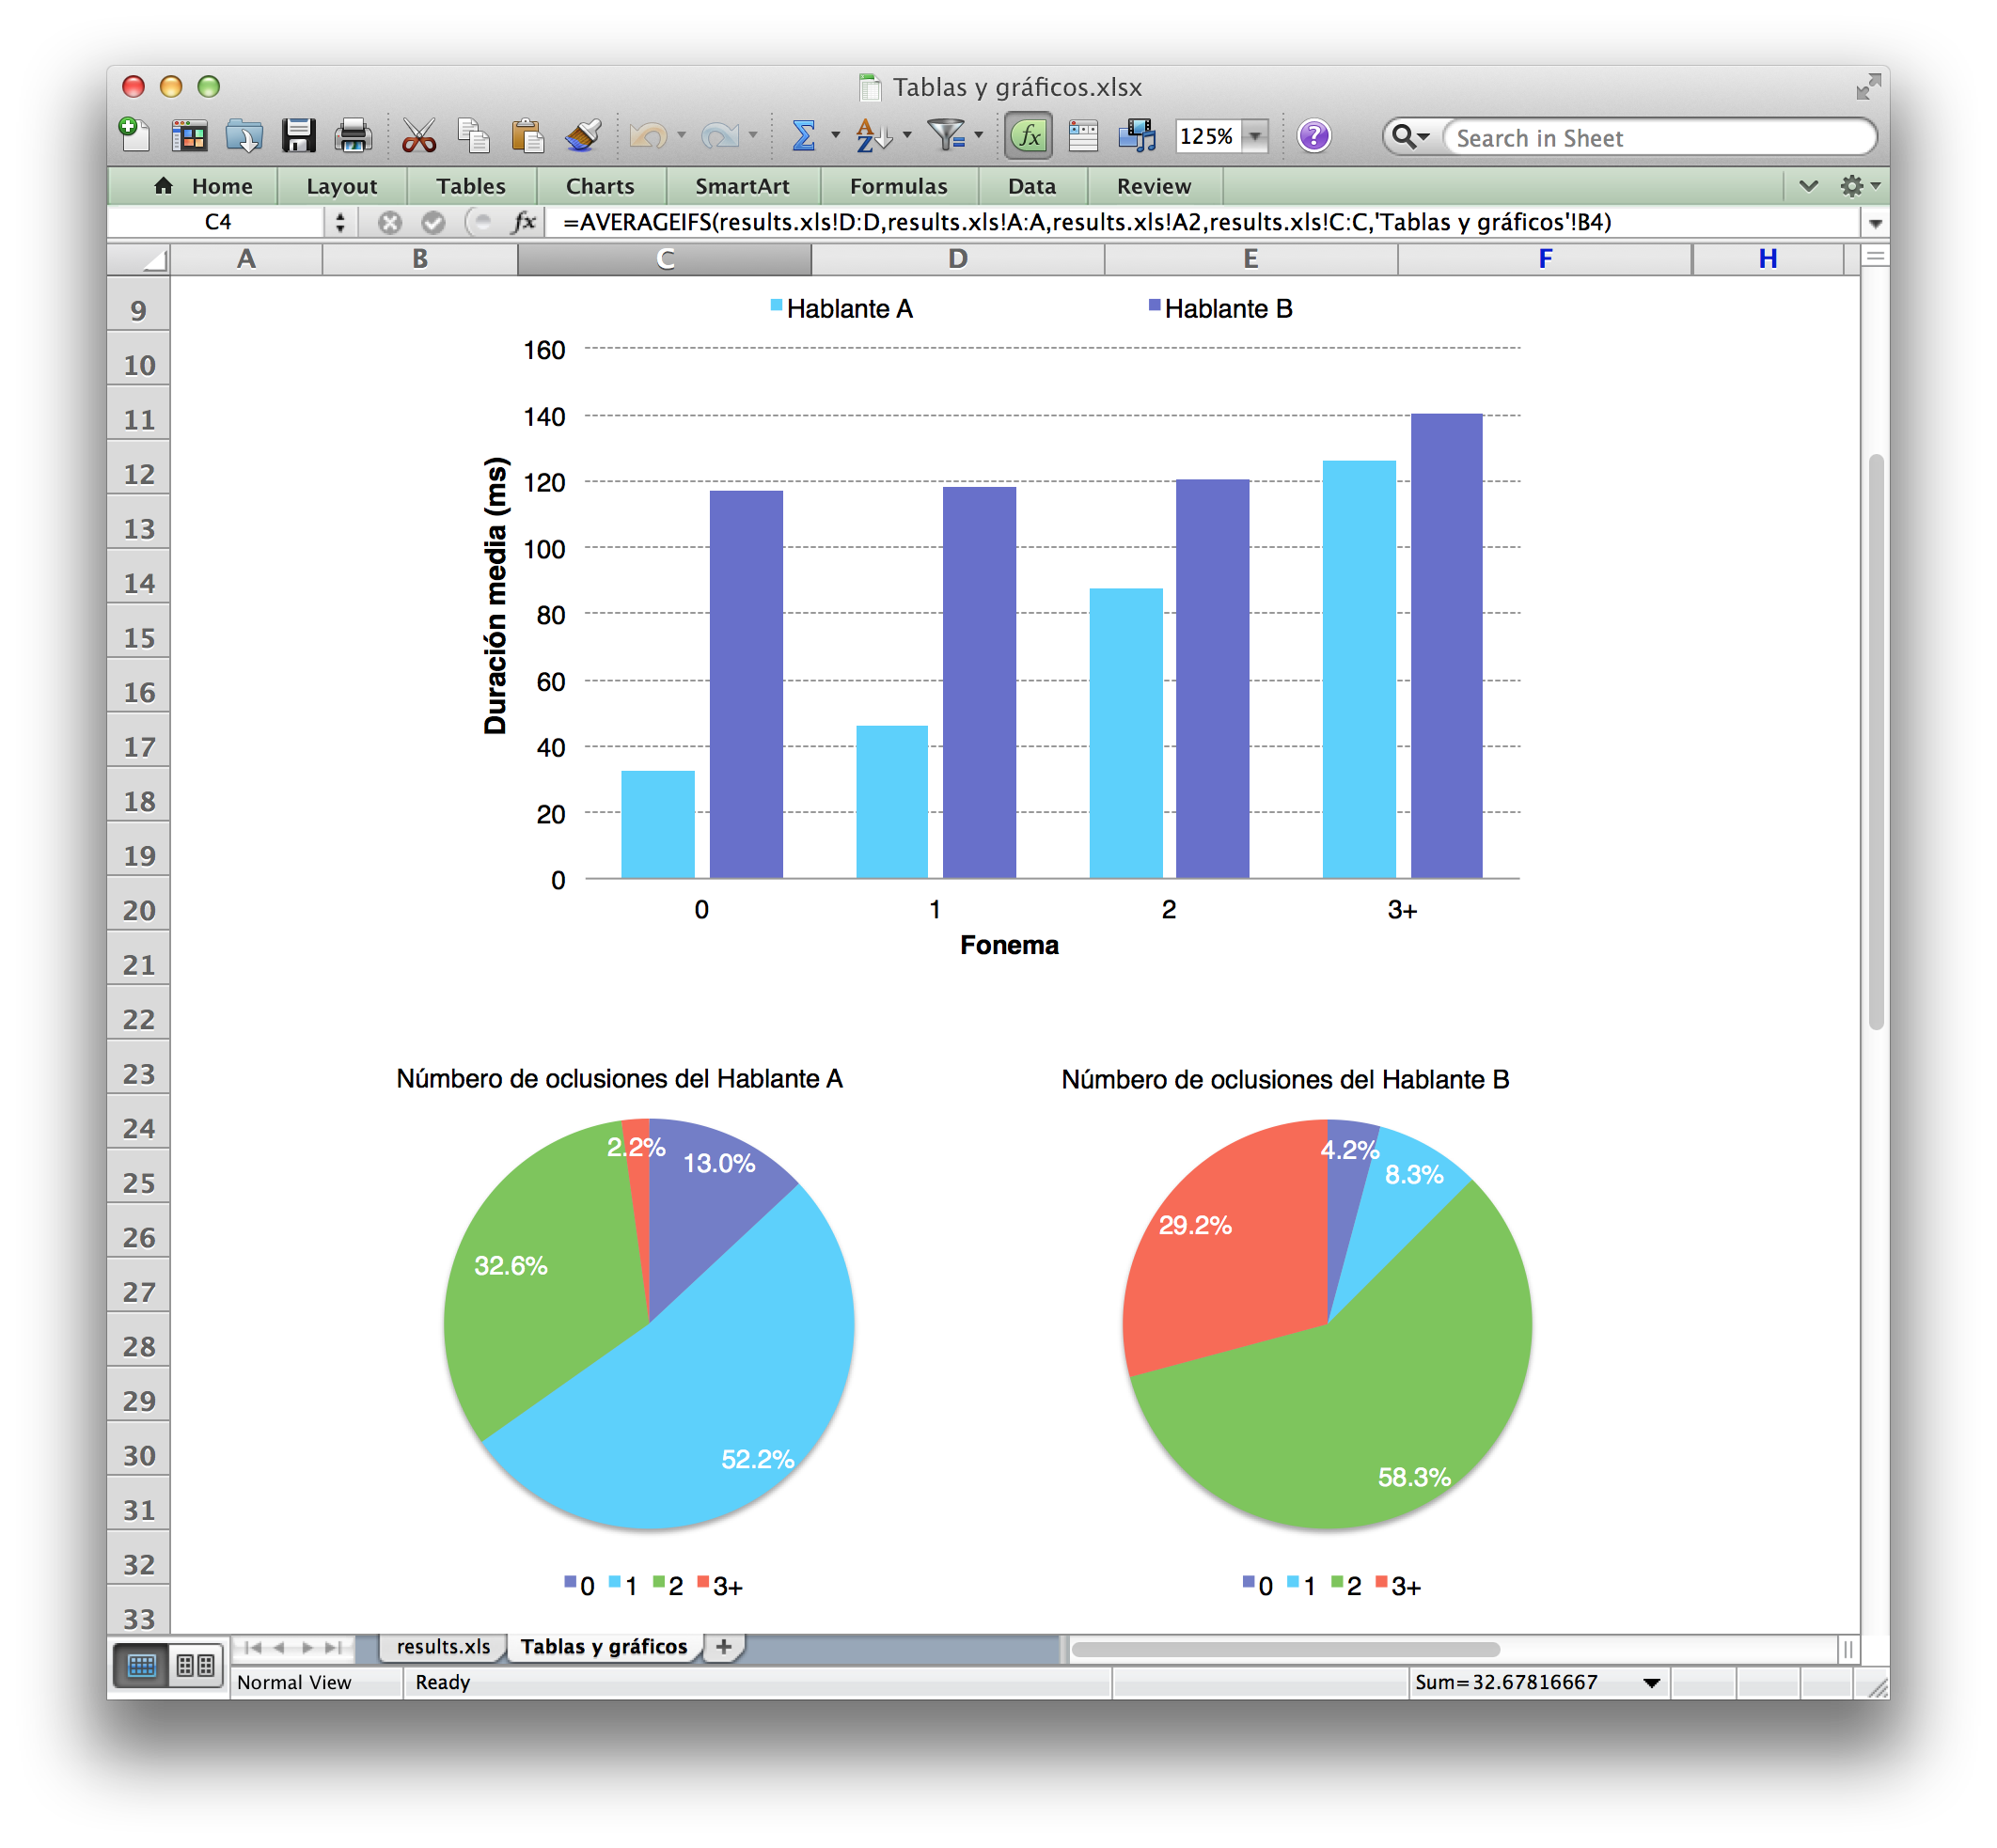
Open Táblas y gráficos.xlsx which contains a template with a table and some graphs. These charts are linked to the table and will automatically update as you input values.
-
Then open results.xls that you obtained after running the script in Praat. This file contains the raw data from the two sound files. This is the data that you will need to use for the table and graphs.
Copy Data
-
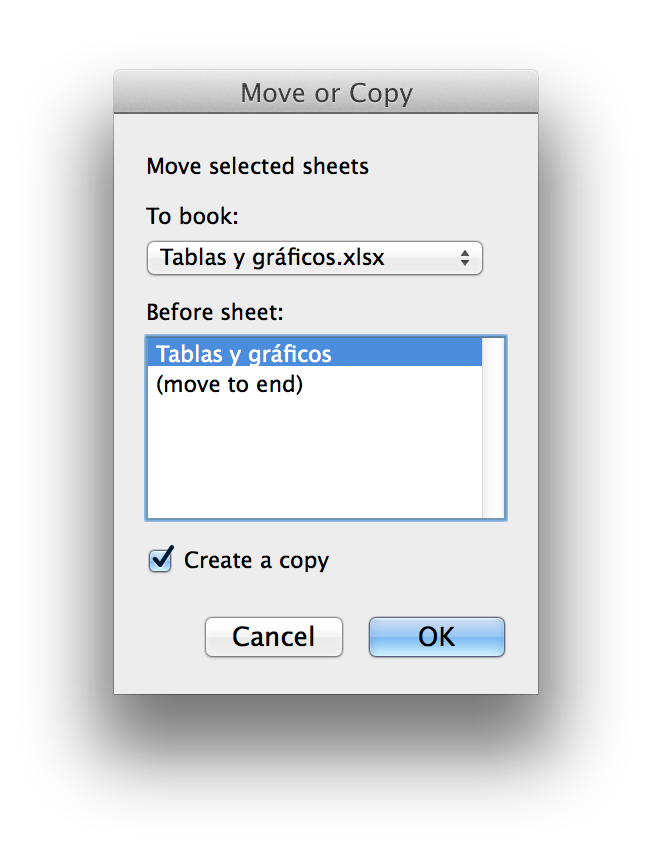
Copy the data from results.xls to Táblas y gráficos.xlsx. Right-click (or Control-click on a Mac with a trackpad) on the tab titled results.xls in the bottom of the window and then click Move of copy….
-
Select Táblas y gráficos.xlsx from the drop-down menu as the destination and then check the checkbox titled Create a copy. Click . You may now close results.xls window.
Average Duration
-
It's time to process the data! For both speakers, you will need to calculate the average duration and frequency for each number of trills.
-
We will use a formula for conditional average, AVERAGEIFS(). It will take five arguments separated by commas:
-
The range of cells to average.
-
The range of cells in which to evaluate the first criteria.
-
The first criteria.
-
The range of cells in which to evaluate the second criteria.
-
The second criteria.
The first criteria will be the speaker and the second criteria will be the number of occlusions.
-
-
Let's begin by calculating the average duration of a trill with zero occlusions for the first speaker.
-
Click on the cell C4.
-
Begin entering the formula by typing =AVERAGEIFS(.
-
Now you need to specify the range of cells to average. Head over to the spreadsheet with raw data by clicking on results.xls on the bottom of Excel window and click on header D to select the column titled Duration (ms).
-
Type , (comma) before selecting the second argument, the first criteria range. The first criteria that we'd like to check is the speaker. Since each speaker has a different sound file, we'll use the first speaker's sound file name as the first criteria and the cells in the column File name as the first criteria range. So click on the header A to select the column with file names.
-
Type , (comma) again and click on the cell A2 (the first cell with the first speaker's file name) to select the file name of the first speaker's sound file as the first criteria.
-
Type , (comma) and click on the header C to select the second criteria range, the cells in the column Number of occlusions.
-
Now we need to give Excel a value that those cells need to satisfy. Recall that we're looking for the average duration of trills with zero occlusions. Type one final , (comma) and head back to the spreadsheet Tablas y gráficos by clicking on the tab on the bottom of Excel window. You now need to click on the cell B4 that holds the value 0. If it is hidden underneath the formula box, manually type B4.
-
End the formula with a final ) and press Enter. You should now see the average duration of trills with zero occlusions produced by the first speaker in the cell C4. If for some reason you have a problem with calculations, make sure that your formula resembles the one shown below:
-
-
Now fill the formula into the cells C5 – C7. Click on the cell C4 and drag the fill handle (small square in the bottom right corner of the cell) down to the cell C7.
#DIV/0!
You may encounter this somewhat cryptic error message in one of the cells as you calculate the average duration. It is there simply to remind you that division by zero is impossible and is probably caused by the absence of trills with a particular number of occlusions (e.g. zero). No need to worry about it, but be sure to remove it if you decide to copy the table into your paper.
-
Repeat the process outline above for the second speaker. Note that the formula in the cell E4 should now look something like
Note that A48 in the above formula is the cell whose value is the file name of the second speaker's sound recording. It may (and most likely will) be different for you. Fill the formula into the rest of the cells in the column by clicking on cell E4 and then dragging the fill handle across E5 – E7.
Frequency
-
Let's now find the frequency of the occlusions! Recall that to calculate frequency of occlusions with n trills for a speaker, we'll need to divide the number of occlusions with n trills by the total number of trills produced by that speaker. In other words, we'll want to count the trills with n occlusions, count all the trills and then divide the first count by the second count.
-
This time we'll use another function, COUNTIFS, that works very similarly to AVERAGEIFS. It will apply criteria across multiple ranges and will return the number of rows with cells whose value satisfy those criteria. This time, the arguments will be the following:
-
The range of cells in which to evaluate the first criteria.
-
The first criteria.
-
The range of cells in which to evaluate the second criteria (if applicable).
-
The second criteria (if applicable).
-
-
We'll start by calculating the frequency of trills with zero occlusions for the first speaker. First, let's calculate the number of trills with zero occlusions.
-
Click on the Cell D4 and begin entering the formula for counting the number of trills with zero occlusions by typing =COUNTIFS(.
-
Switch to results.xls spreadsheet and click on header A to select the column File name as the first criteria range.
-
Next type , (comma) and click on the cell A2 to select the first speaker's file name as the first criteria.
-
Type another , (comma) and click on header C to select the second criteria range, the cells in the column Number of occlusions.
-
Again, type a , (comma) and return to Tablas y gráficos spreadsheet and click on the cell with the value of 0, which should be the cell B4. If it is hidden behind a formula box, manually type B4 on your keyboard. Close the parentheses by typing )
-
-
Now you need to divide that value by the total number of trills produced by the first speaker, so type a / (forward slash), which stands for division. Next, write a call to another COUNTIFS function that will count the total number of trills.
-
Type COUNTIFS( to begin writing the function, which will now have only two arguments: a single range and a single criteria.
-
Head to results.xls spreadsheet and click on header A to select the column File name as the only range.
-
Type a , (comma) and click on the cell whose value is the speaker's filename (cell A2) to count only the cells with that value.
-
Type ) to close the parentheses and press Enter. A value between 0 and 100 percent should appear in the cell D4. If you don't see it and are lost, check that your formula is similar to the following:
-
-
Click on the cell D4 and drag the fill handle across the rest of the cells in the column to fill the formula into cells C5 – C7.
-
Repeat the procedure for the second speaker. If something goes wrong and unsure how to proceed, re-watch the video and ensure that the formula in the cell F4 looks somewhat like
Again, the above formula may not work for you and yours will probably be slightly different, since the name of the second speaker's sound file might not be in cell A48 for you.
-
At this point, you should see charts (bar and pie) reflect the values in the table!
What's Next
-
Write a report as per the guidelines on Canvas. Be sure to include tables and graphs. Once you have finished with your report, review it checking that you have made no errors and that you have included all the necessary components and details.
-
Submit the report on Fri 12/20.