Data due Sat 3/21 via Canvas; report due Wed 3/25 in class
Project Files
Download project files by clicking here.
Getting Started
-
Recall that Praat is a program that allows you to do phonetics by computer. With it, you can analyze, synthesize and manipulate speech. In this first data analysis, you will use Praat to compare the difference in intensity among stop consonants (/p/, /t/, /k/, /b/, /d/, /g/) and /s/. You will then use this data to contrast Castilian and Andalusian speaker production.
-
Make sure that you are running the latest version of Praat. To download Praat, head to http://www.praat.org (which will redirect you to http://www.fon.hum.uva.nl/praat/). In the Download Praat section in the top left corner of the page, select your platform (Macintosh or Windows).
-
Be sure to download the 64-bit version of Praat if you are using a Mac.
-
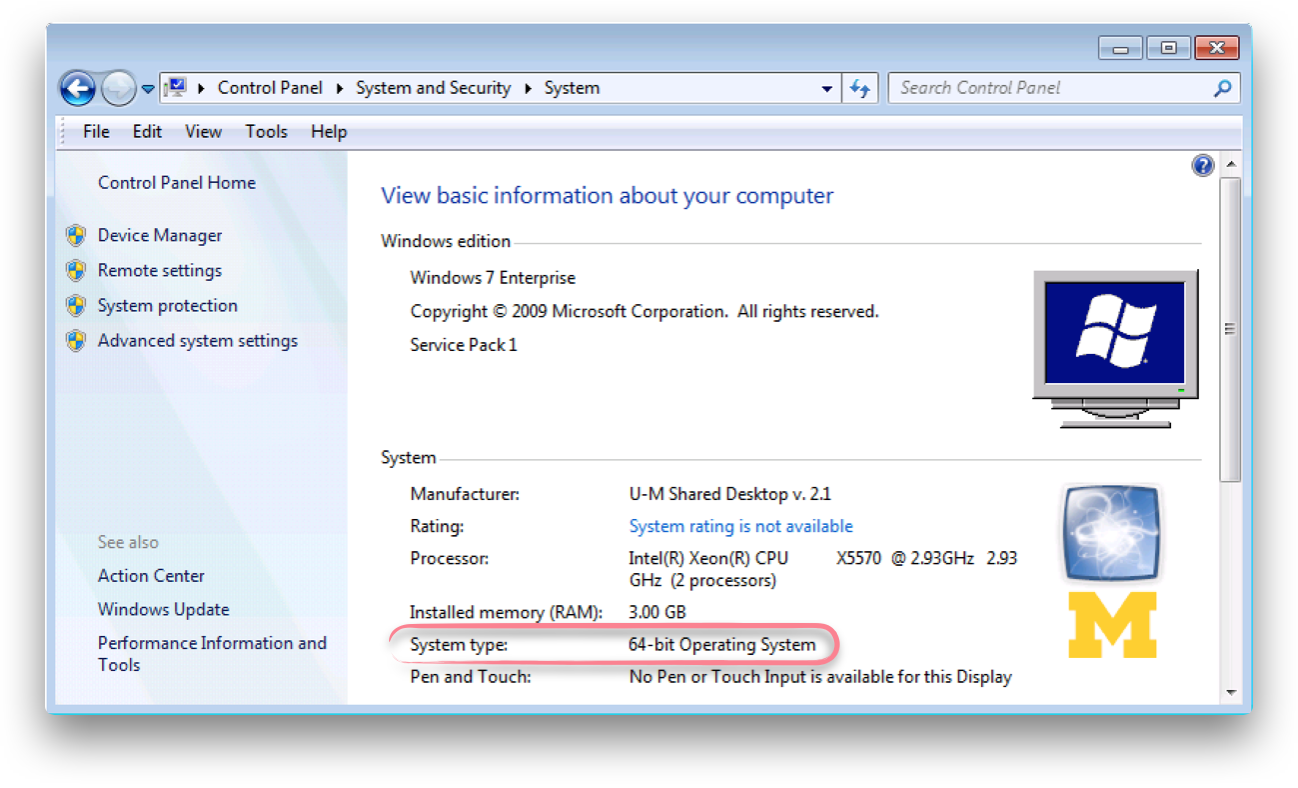
If you are working on a Windows PC, check if it is a 64-bit system. Open Control Panel and go to System and Security > System. The System type: line will detail the operating system type. If you have a 64-bit operating system, download the 64-bit edition of Praat, else download the 32-bit one.
-
-
Create a folder on your computer wherein you will keep all the files related to this project. Download the project files from CTools and move them to that folder, along with the sound files that you will be analyzing. Also consider backing up (via Time Machine, Dropbox, etc.), so as not to lose your work in case of an unforeseen event.
Intro to Praat
Before you begin, take a look at an overview of Praat:
Open a long sound file
-
First open the file of your narration of the Frog Story. This file is quite long, so you’ll need to open it as a long sound file. Click Open and then Open long sound file… in the Praat Objects window. Then navigate to your file and click OK.
-
Ensure that your sound file is a WAV file. If your file is in another format, convert it before proceeding. After opening your file, click Save and then Save as WAV file…. Choose the destination and click OK.
-
Click View to view the file.
Navigation
-
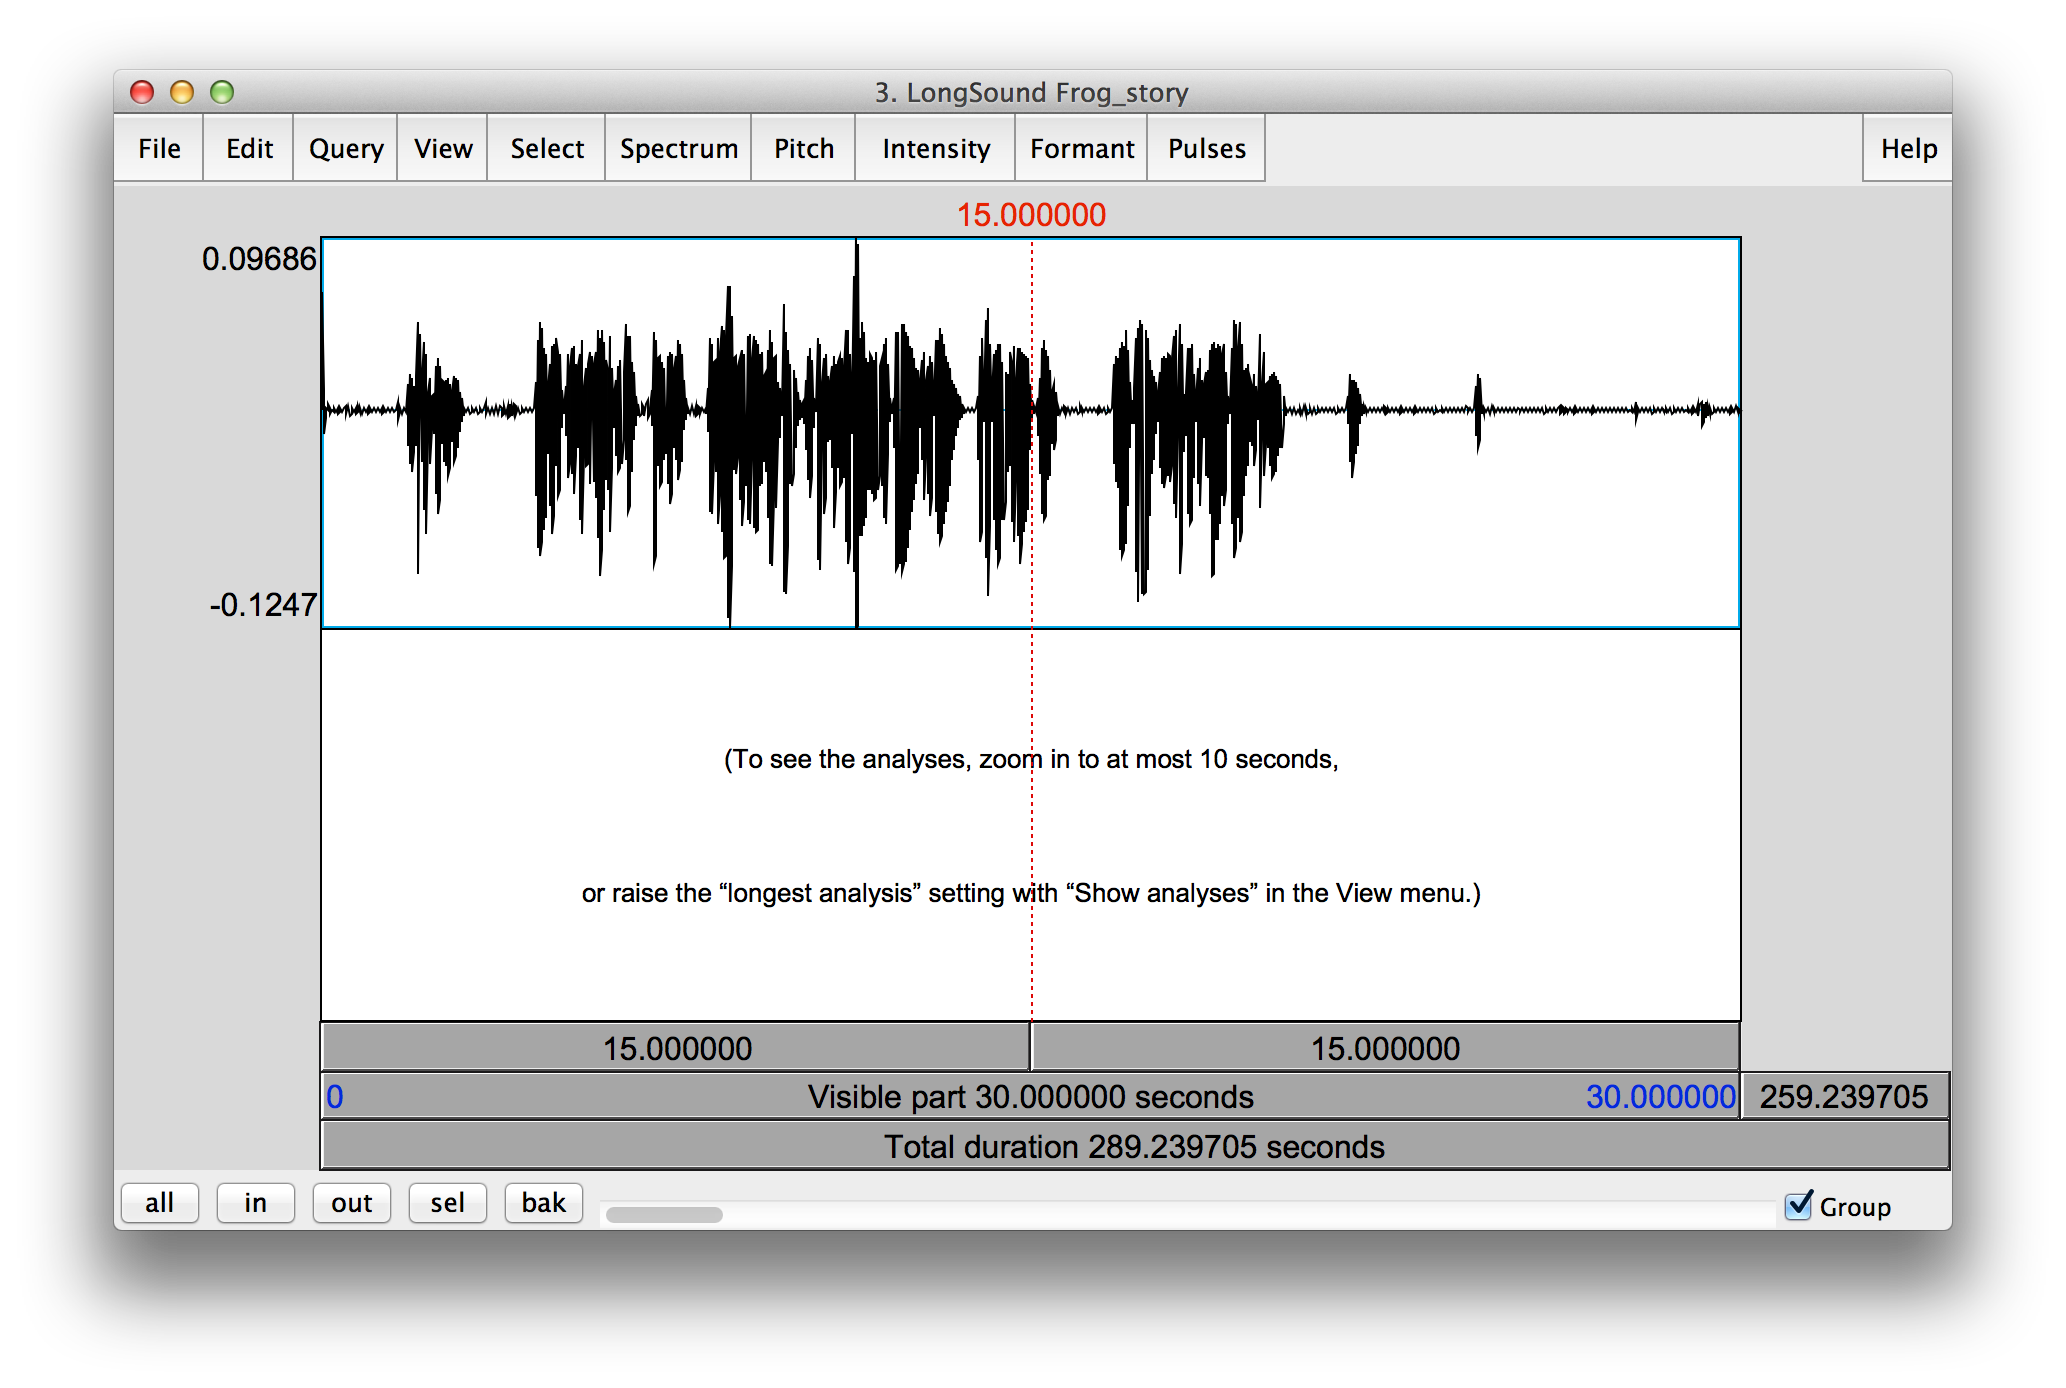
Your window should look similar to the one pictured below, with the waveform of the LongSound shown in the upper part.
-
Remember the following keyboard shortcuts when working with a sound file Praat:
Action Mac Windows Zoom in
Command-I
Control-I
Zoom out
Command-O
Control-O
Zoom to selection
Command-N
Control-N
Zoom all
Command-A
Control-A
Play or stop
Tab
Tab
-
Know that you can also pinch to zoom and swipe with two fingers to scroll left and right if you are using a Mac with a trackpad.
-
Feel free to procrastinate a bit and explore Praat. Select different regions and play them by pressing Tab. Notice how production of various sounds charges according to their position.
-
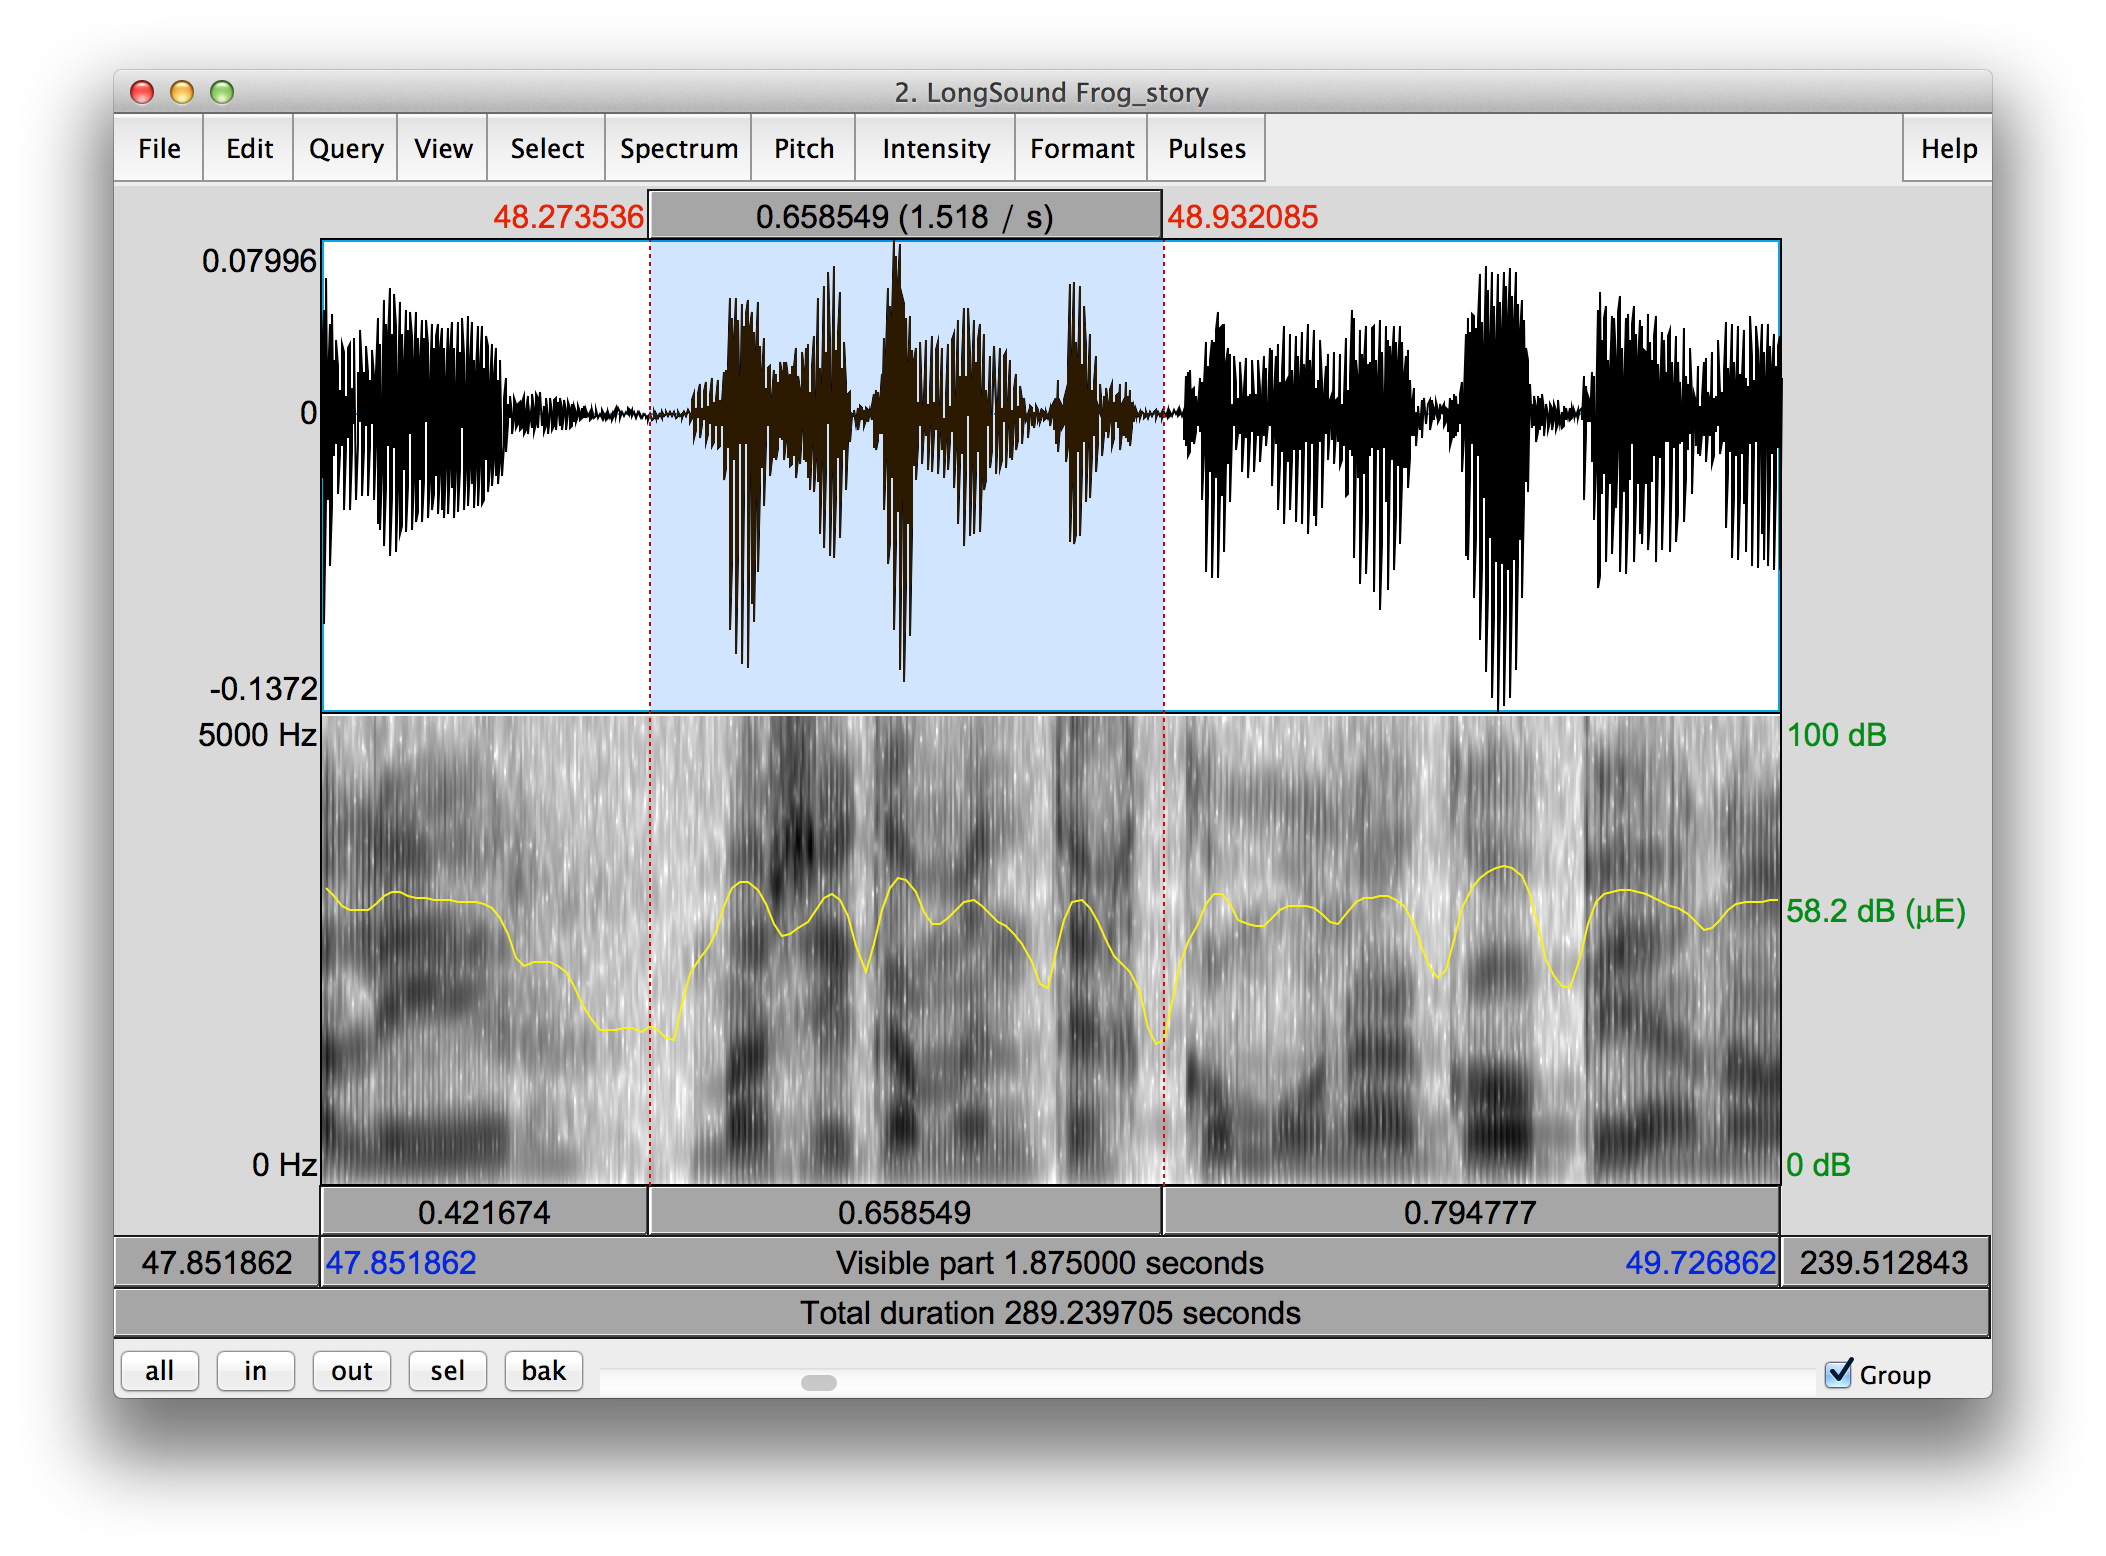
You will see the spectrogram if you zoom in close enough. If you see blue lines, yellow lines or red dots on the spectrogram, then Praat is configured to show pitch, intensity or formants. While these might be helpful when labeling vowels, they will significantly slow Praat down, as it will have to redraw them every time you scroll. You may disable them by clicking on Pitch, Intensity and Formant and by unchecking Show pitch, Show intensity and Show formants. Feel free to leave the intensity curve as it my help you see the stop consonants.
Segments
-
Before extracting intensity of /p/, /t/, /k/, /b/, /d/, /g/ and /s/ in intervocalic position from a sound file containing Frog Story narration, you will need to save segments that contain these consonants as separate files.
-
Within your project folder, create two new folders that will contain the smaller sound files, one for each of the longer files. Use descriptive names for the folders, such as segments Castilian and segments Andalusian.
-
Look for /p/, /t/, /k/, /b/, /d/, /g/, /s/ in intervocalic position. Those in the beginning of the word are fine, so long as they directly follow a vowel (e.g. te quiero – /tekiero/). You may find it helpful to first consult the transcription of the story.
-
When you find a word (or two adjacent words) containing one of the consonants in intervocalic position, select the region with the mouse, then click File and then Save selected sound as WAV file. Navigate to one of the folders that you you have just created. Be sure that it is the folder that corresponds to the sound file, else the data for the Castilian and Andalusian speakers will be mixed.
-
Name the sound file [consonant]_[word].wav, but take care not to use any diacritics, such as accent marks or tildes (which may cause you problems when running the intensity script). So if you have spotted the word básicamente, which contains the consonant s between two vowels, name the sound file s_basikamente.wav. If you have noticed that the word pues directly follows a vowel (e.g. the final a in the word viñeta), be sure to select at least some part of viñeta (e.g. iñeta) and save the file as p_inetapues.wav.
-
Find other words containing /p/, /t/, /k/, /b/, /d/, /g/ and /s/ in intervocalic positions. You will need 70 words (ten per phoneme) for each of the two sound files (a grand total of 140). Be sure to save the segments to the correct folder.
Annotation in Praat
Now, take a look at the TextGrid:
Open a sound file
-
Once you have extracted segments containing one of the consonants in intervocalic position, you’ll have to annotate them. Annotation refers to segmentation (splitting a sound into intervals) and labeling (giving names to intervals). In Praat, we you TextGrid objects for annotation. When you later extract intensity using a script, Praat will look in the corresponding TextGrid object to find intervals that represent the consonant and the following vowel and return the intensity values for those intervals.
-
To annotate a sound, first open it in Praat. In the Praat object window, click Open and then Read from file…. Navigate to your file and click Open.
Create a TextGrid object
-
We will be using TextGrid objects to annotate consonants and vowels in sound files. Once you have opened a sound file, create a TextGrid object by clicking Annotate and then To TextGrid in the objects window.
-
For our purposes, we will only use one tier and we’ll call it text. Leave point tiers field blank. Be sure that your dialog window looks similar to the one below and then click OK. +image::textgrid-create.png[width="634", align="center"]
Edit the TextGrid
-
Let’s open the TextGrid object. It is far more useful to view it with a sound file, so select both Sound object and the TextGrid object while holding the Shift key on your keyboard and click View & Edit.
-
Now it’s time to find the consonant (/p/, /t/, /k/, /b/, /d/, /g/ or /s/) and the following vowel. Consonants are usually the lighter regions on the spectrogram because the mouse is closed when they are produces. Feel free to zoom in to better see the waveform and the spectrogram.
-
First create intervals on the TextGrid. When you have found a phoneme, click on its starting point on the waveform or spectrogram and then press Enter on your keyboard to add a left boundary. Next, click on the ending point and press Enter to add a right boundary. You have now created an interval! Alternatively, use the mouse to select a region and then press Enter on your keyboard to create an interval in one step.
-
Note that you can click and drag a boundary left or right to adjust it. You can also press Option–Delete on Mac or Alt–Delete on Windows to delete a boundary you no longer need.
-
Once you have an interval, click on it in the TextGrid part of the window. Press Tab to play it and ensure that you have selected the right region. Adjust it if not.
-
Next, label the interval by typing the name of the phoneme that the interval represents on your keyboard.
-
Add another boundary to represent the end of the interval that contains the vowel.
-
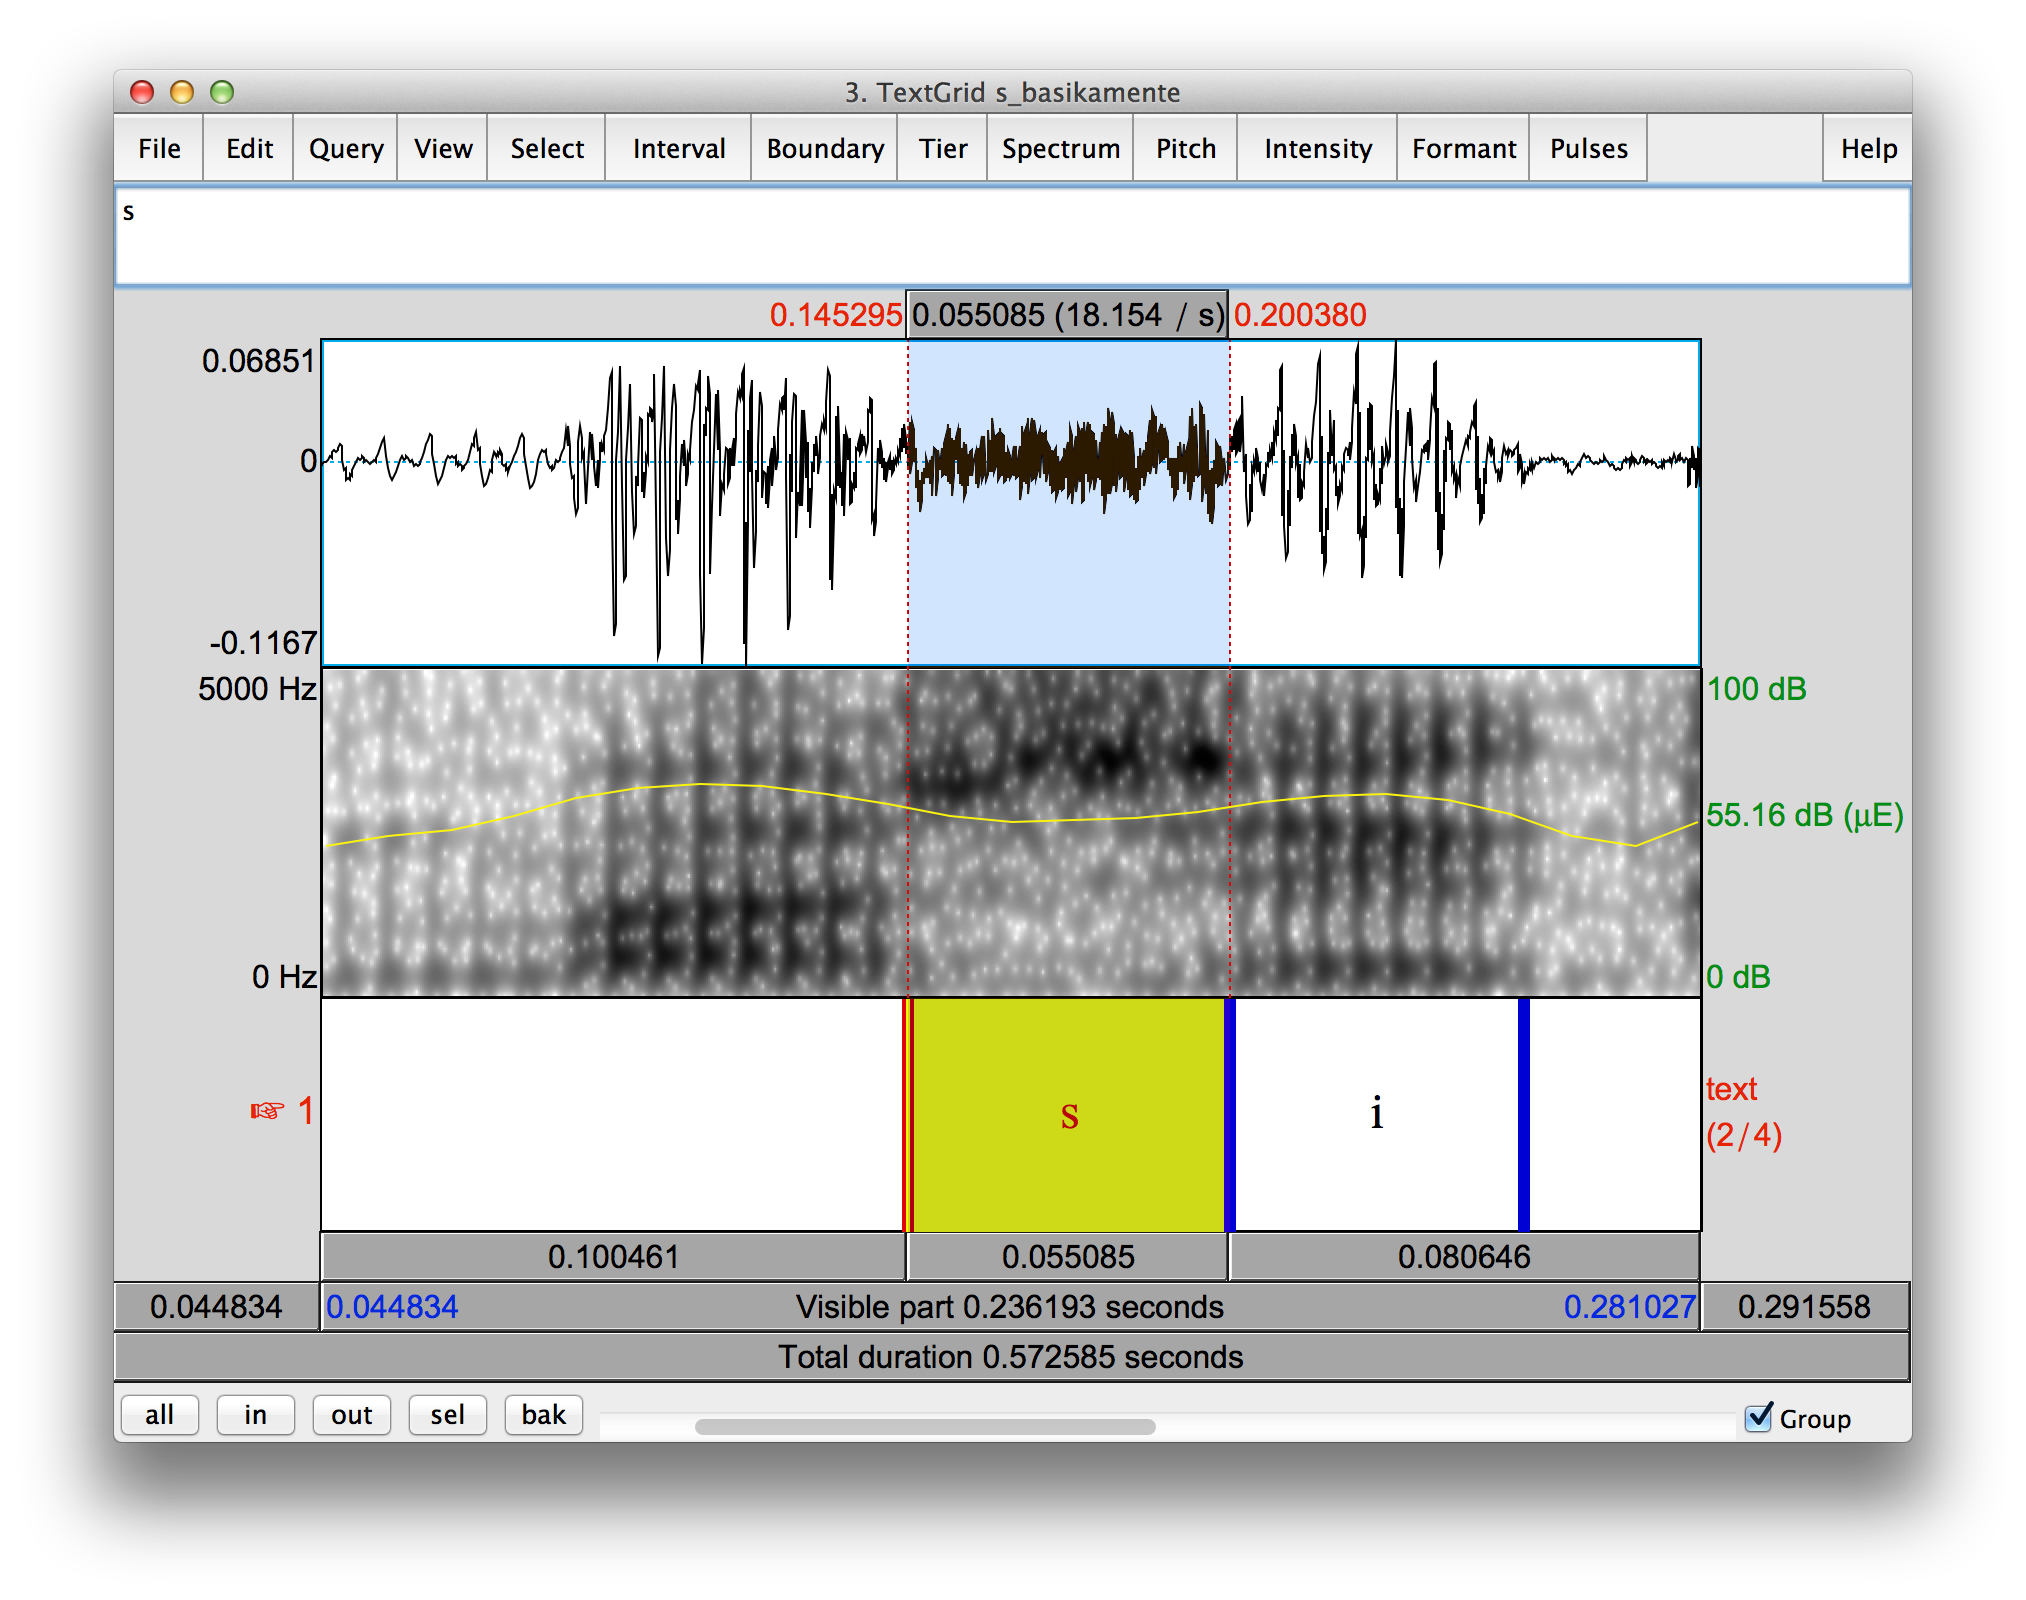
An annotated sound file should have a total of four intervals and look similar one pictured below:
Save the TextGrid
Do not forget to save the TextGrid object after annotating a sound file. Once you have labeled the consonant and the following vowel, click File in the editor window and then Save TextGrid as text file…. Choose the destination (which should be the same folder as the location of the corresponding sound file) and click OK. Again, be sure that TextGrid is saved to the correct folder.
-
Repeat this process as you annotate the rest of the sound files for both speakers.
Intensity Script
Watch this video that shows how to run scripts in Praat:
Open the vowel script
-
It is now time to ask Praat to extract formant frequencies from the sound files that we have annotated. You will have to run the script twice (once per speaker).
-
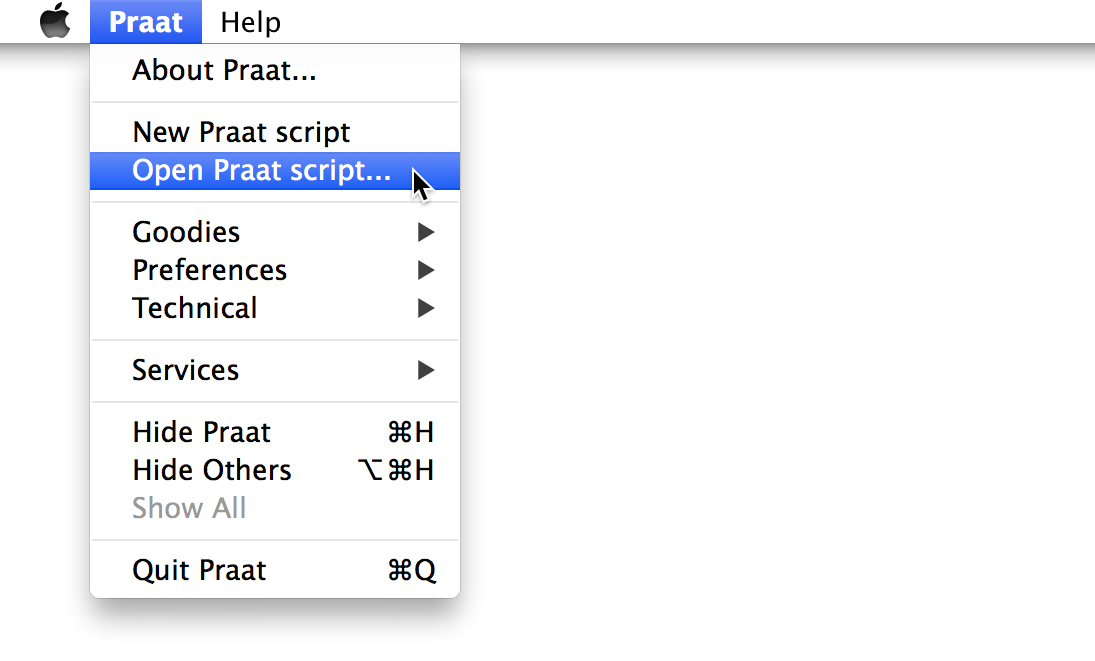
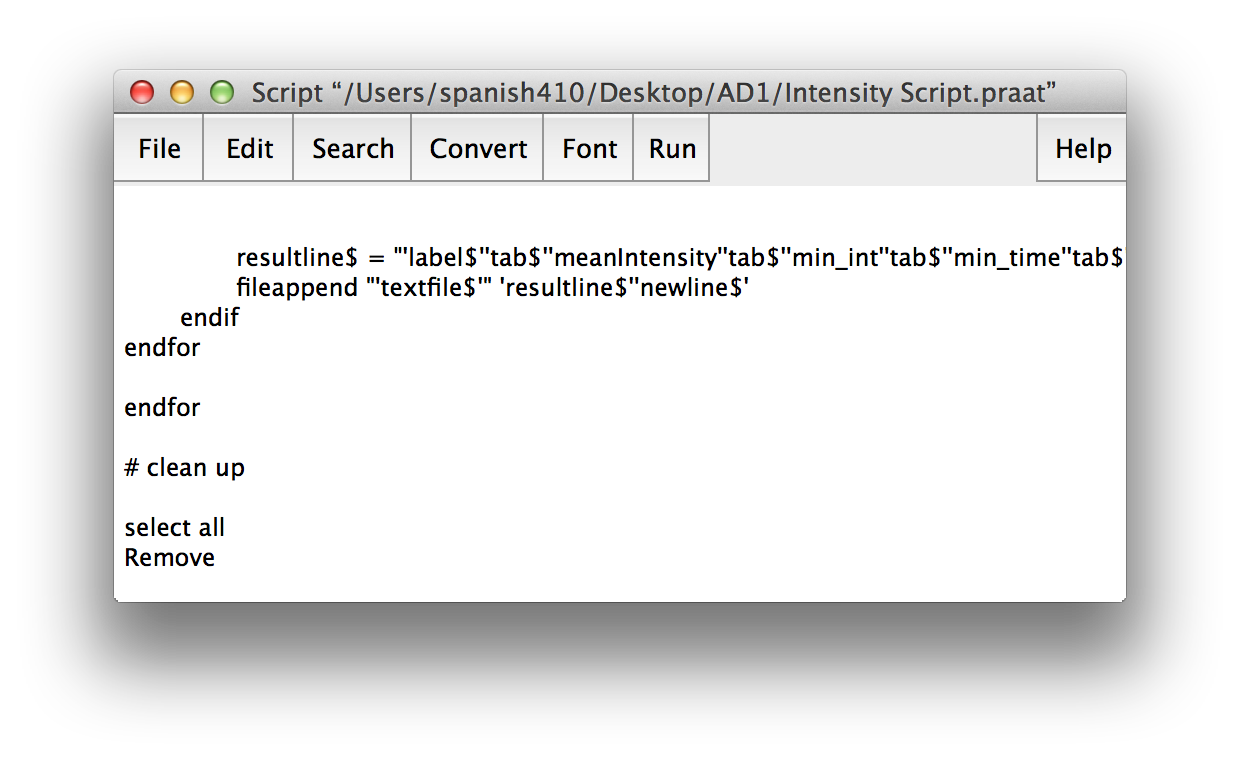
Double-click on Intensity script.praat to open it. Alternatively, click Praat and then Open Praat script… in the menu bar. Then navigate to Intensity script.praat and click OK.
Run
-
A script editor window should appear. Click Run and then Run again.
-
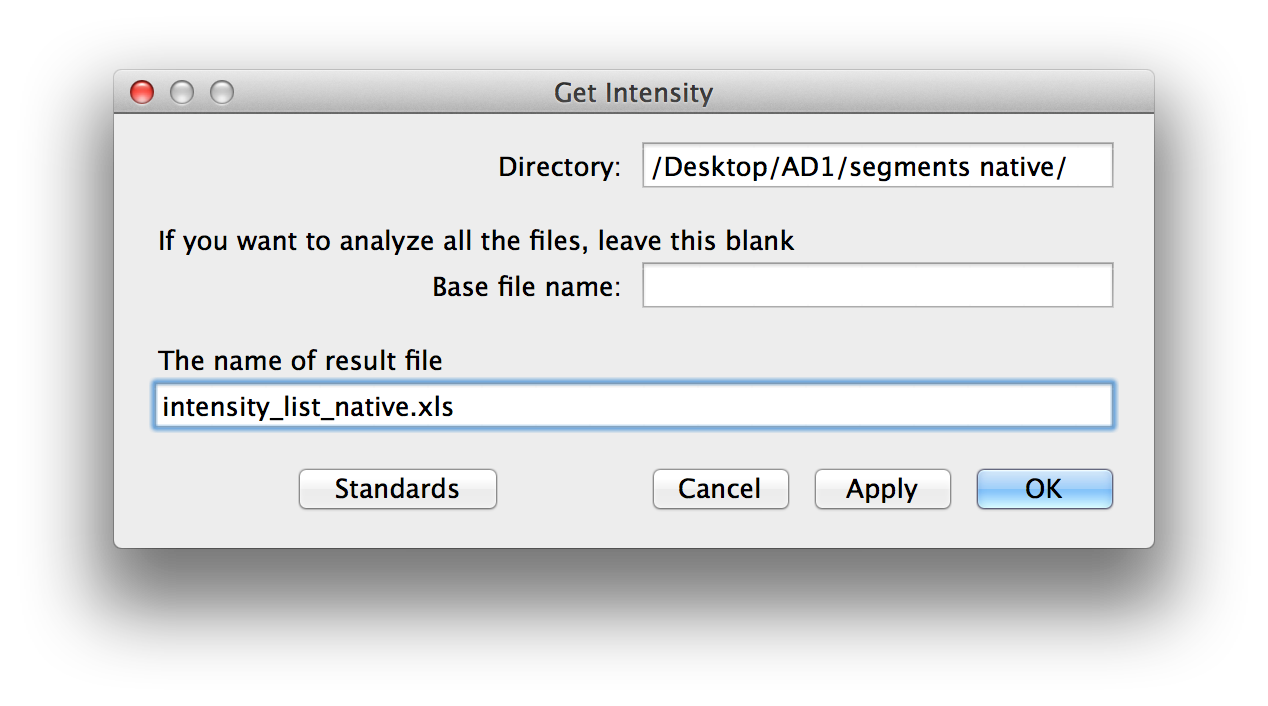
Type the directory of the folder with the TextGrid files and segments from which you wish to extract the intensity:
-
If you have put your sound files into a folder called segments, which is inside AD1 on your Desktop, it should look something like this if you are on a Windows computer:
C:\Users\[username]\Desktop\AD1\segments\
-
And like this if you are using a Mac:
/Users/[username]/Desktop/AD1/segments/
-
-
If you are on a Mac, you can also drag the folder and drop it into the empty text field. Be sure to end the file path with a / to indicate a folder.
-
Finally, rename the resulting file to be intensity_list_native or intensity_list_non-native (Castilian and Andulusian respectively) depending on the speaker and change the extension to .xls, so that it can be easily opened in Excel. Click OK to run the script.
-
Run the script the second time for to extract formant frequencies from sound files of the other speaker.
Intensity Chart (Excel)
Let’s take a look at Excel:
Copy results
-
Open 0 in Excel.[1] Here you will create a bar chart from a template by entering the values in the table.
-
Also open one of the intensity lists that was output by Praat after running the script.
-
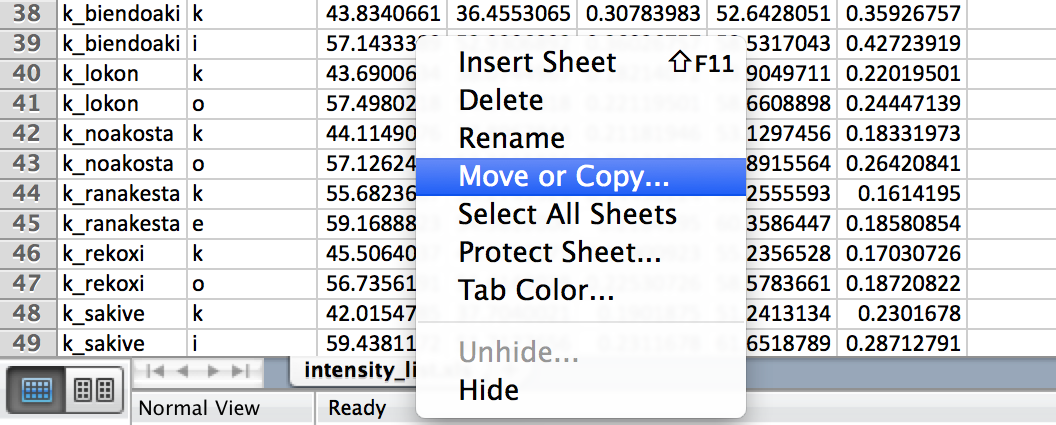
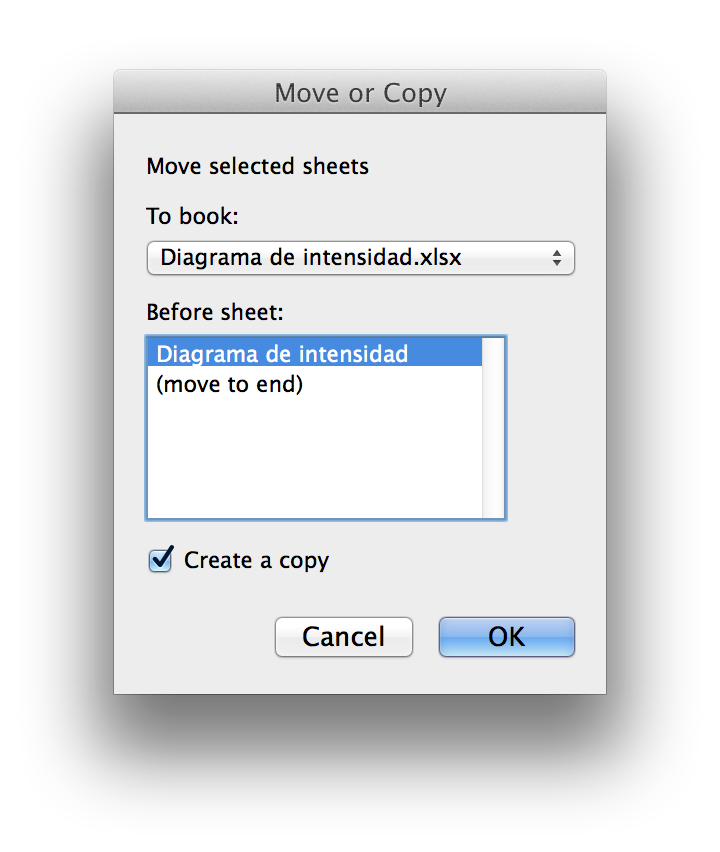
Copy the data to Diagrama de intensidad.xlsx. If the file you have opened is intensity_list_native.xls, right-click the tab titled intensity_list_native.xls on the bottom of the window and then click Move or Copy….
-
Select Diagrama de intensidad.xlsx as the destination and check the check box titled Create a copy and then click OK.
-
Open the other intensity list that and copy the data to Diagrama de intensidad.xlsx in the same way. Then close both intensity list files, leaving only Diagrama de intensidad.xlsx open.
Calculate intensity difference
-
Now you’ll have to calculate the difference between the intensity of every /p/, /t/, /k/, /b/, /d/, /g/, /s/ and the following vowel.
-
Select one of the sheets with intensity lists in Diagrama de intensidad.xlsx.
-
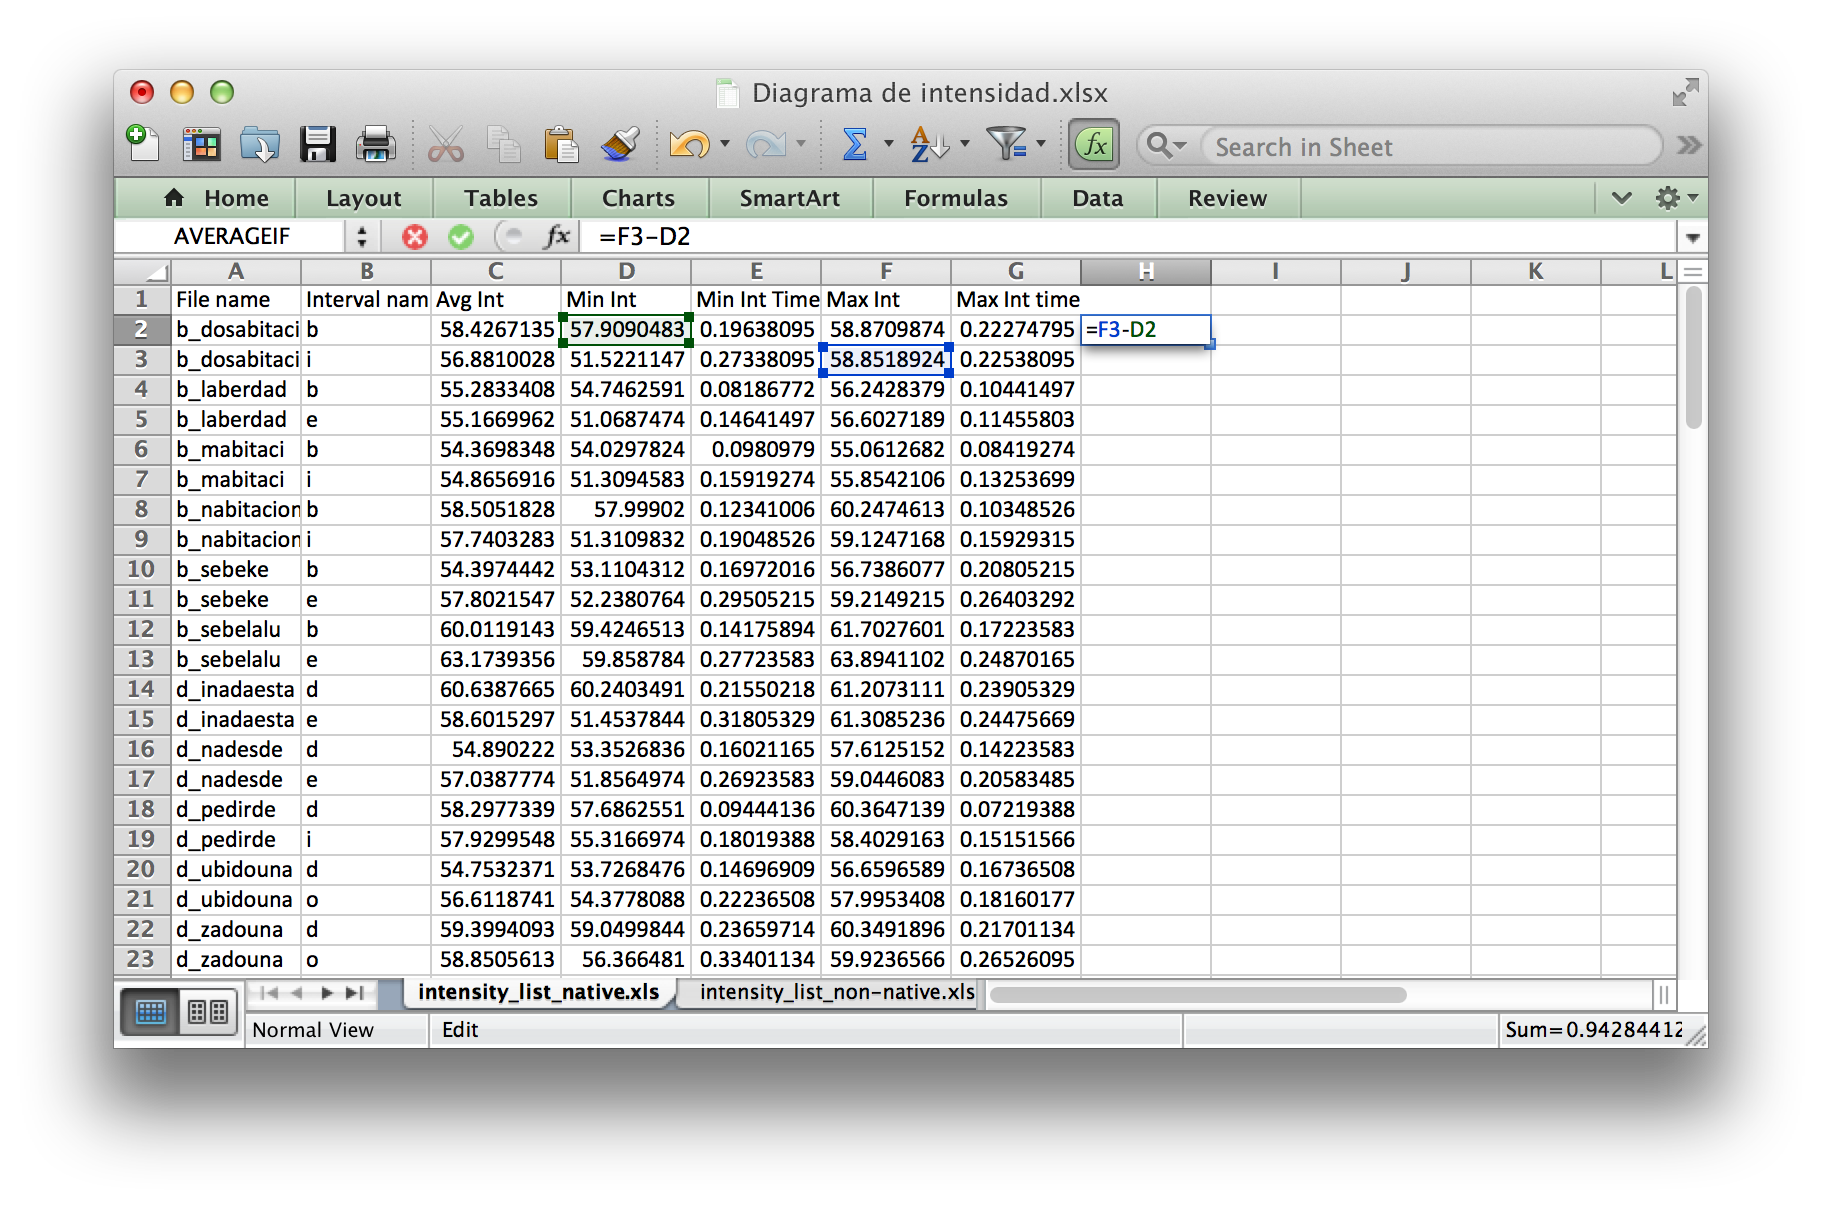
Column H will hold the values for the intensity difference of the phonemes. Type
Int difference
in the cell H1. In the cell H2, type
=F3–D2
to subtract the minimum intensity of the consonant from the maximum intensity of the following vowel.
-
Then select both H2 and H3, and fill the formula into every other cell in the column H by dragging the small blue square down to row 141.
-
Switch to the sheet with the intensity list of the other speaker and calculate the intensity difference in the same way.
Complete the table
-
Go back to the Diagrama de intensidad sheet by clicking on the tab Diagrama de intensidad tab on the bottom of the Excel window.
-
We now need to complete with the average intensity difference for each phoneme. Let’s start with /p/ for the Castilian speaker. We’ll use the AVERAGEIF function to calculate the average intensity difference for a specific phoneme. It takes three arguments separated by commas: the range of the cells in which to evaluate the crirea, the criteria that defines which cells will be added, and finally the actual cells to average.
-
So in cell C4, type =AVERAGEIF(, then head to the sheet with the intensity list of the Castilian speaker (i.e. intensity_list_native.xls) and click on the header B to select the column titled Interval name as the first argument, then type , (comma). Next click on Diagrama de intensidad tab to go back to the intensity chart seer and type B4 to indicate that the criteria is the phoneme in that cell. Then type , (comma) and head back to intensity_list_native.xls and click on the header H to select the column Int difference as the third argument. Finish the formula by typing ) (left parenthesis) and press Enter. Your formula should look like the one below:
=AVERAGEIF(intensity_list_native.xls!B:B,'Diagrama de intensidad'!B4,intensity_list_native.xls!H:H)
-
Now let’s calculate the intensity difference of /p/ for the Andalusian speaker. In cell D4 of Diagrama de intensidad, type =AVERAGEIF(, then click on the header B in intensity_list_non-native.xls sheet to select the Interval name as the first argument, then type , (comma). Go back to Diagrama de intensidad and type B4. Then again type , (comma) and click on the header H in intensity_list_non-native.xls to select the column Int difference as the third argument. Finally, ) (left parenthesis) and press Enter. Your formula should look like the one below:
=AVERAGEIF(intensity_list_non-native.xls!B:B,’Diagrama de intensidad'!B4,intensity_list_non-native.xls!H:H)
-
Fill the formula into the rest of the table. Select cells C4 and D4 and then drag the small square in the bottom right corner of the selection across the rest of the cells in the table. The bars should appear in the intensity chart.
Intensity Chart (Numbers)
Copy results
-
Open 0 in Numbers.[2] Here you will create a bar chart from a template by entering the values in the table.
-
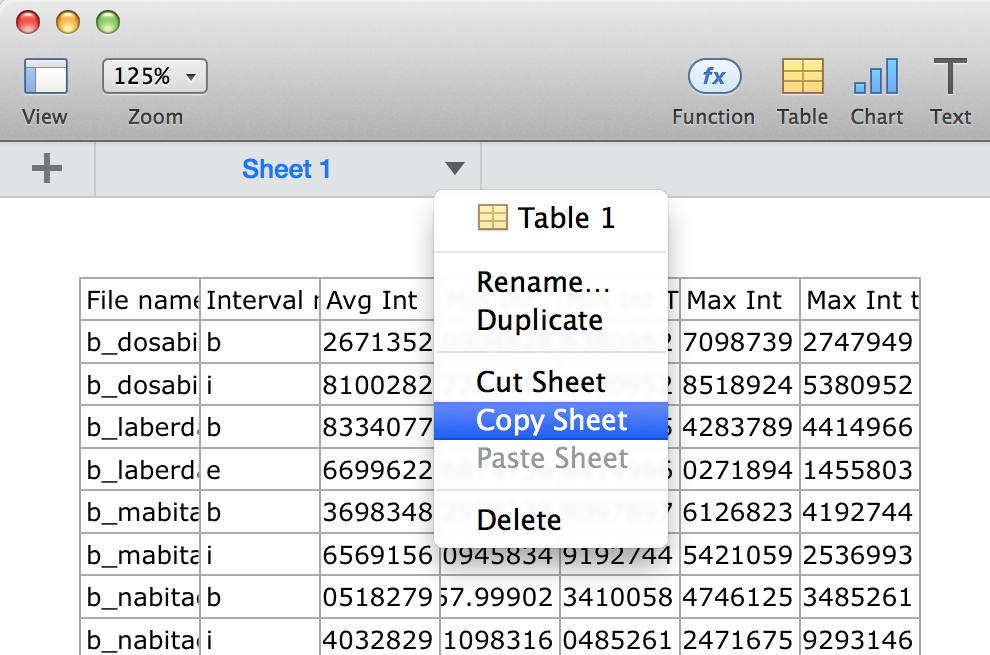
Open one of the intensity lists of the Castilian speaker that was output by Praat after running the script. Copy the data to Diagrama de intensidad by clicking on the arrow next to Sheet 1 and then clicking Copy Sheet. Then go back to Diagrama de intensidad and click Paste Sheet. Rename the sheet to intensity list native.
-
Now open the intensity list of the Andalusian speaker. Copy it and paste it into Diagrama de intensidad. Rename the sheet to intensity list non-native.
Calculate intensity difference
-
Now you’ll have to calculate the difference between the intensity of every /p/, /t/, /k/, /b/, /d/, /g/, /s/ and the following vowel.
-
Select one of the sheets with intensity lists in Diagrama de intensidad file.
-
Create a new column by dragging
 to the right.
 -
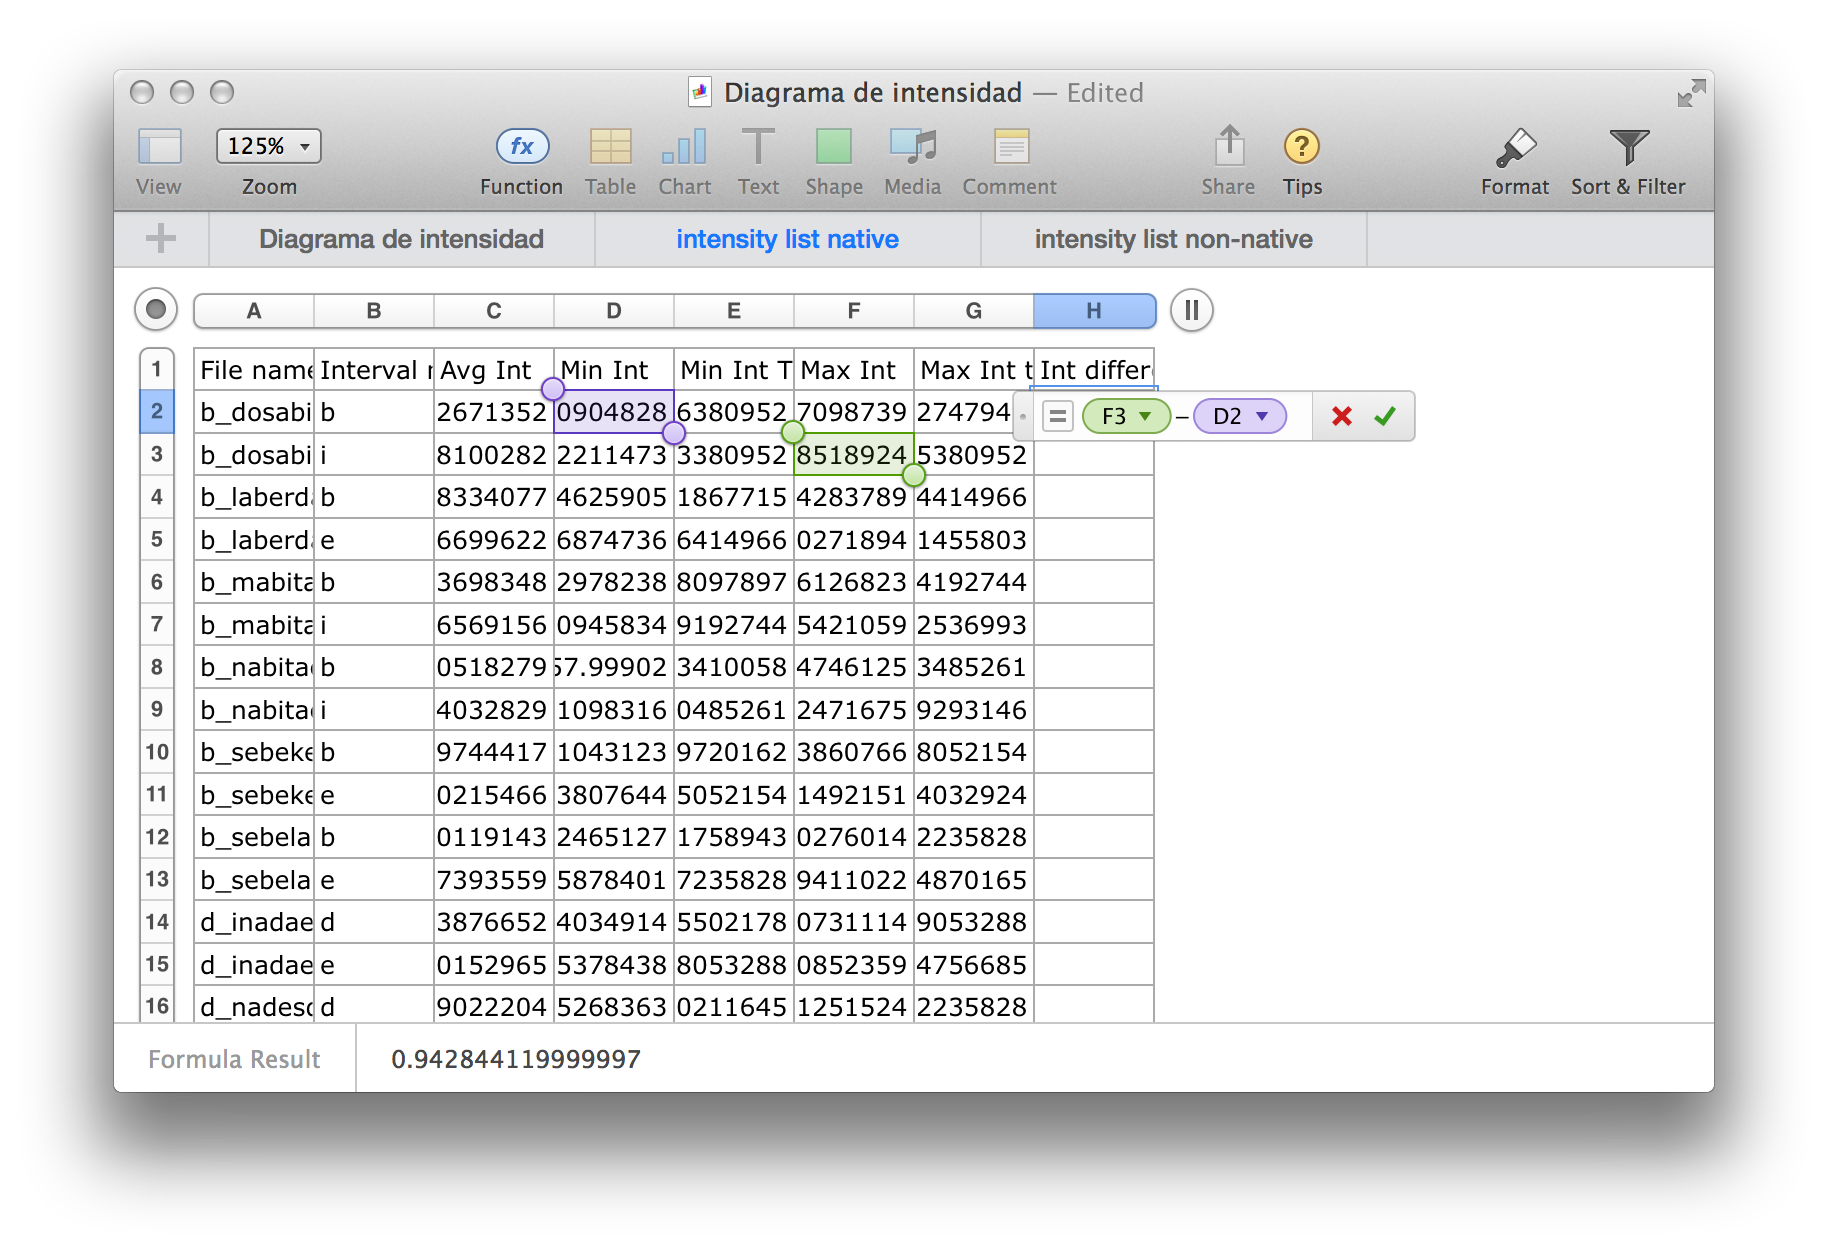
Column H will hold the values for the intensity difference of the phonemes. Type Int difference in the cell H1. In the cell H2, type =F3–D2 to subtract the minimum intensity of the consonant from the maximum intensity of the following vowel.
-
Then select both H2 and H3, and fill the formula into every other cell in the column H by dragging the small yellow circle down to row 141.
-
Switch to the sheet with the intensity list of the Andalusian speaker and calculate the intensity difference in the same way.
Complete the table
-
Go back to Diagrama de intensidad sheet by clicking on Diagrama de intensidad tab on top of the window.
-
We now need to complete with the average intensity difference for each phoneme. Let’s start with /p/ for the Castilian speaker. We’ll use the AVERAGEIF function to calculate the average intensity difference for a specific phoneme. It takes three arguments separated by commas: the range of the cells in which to evaluate the critea, the criteria that defines which cells will be added, and finally the actual cells to average.
-
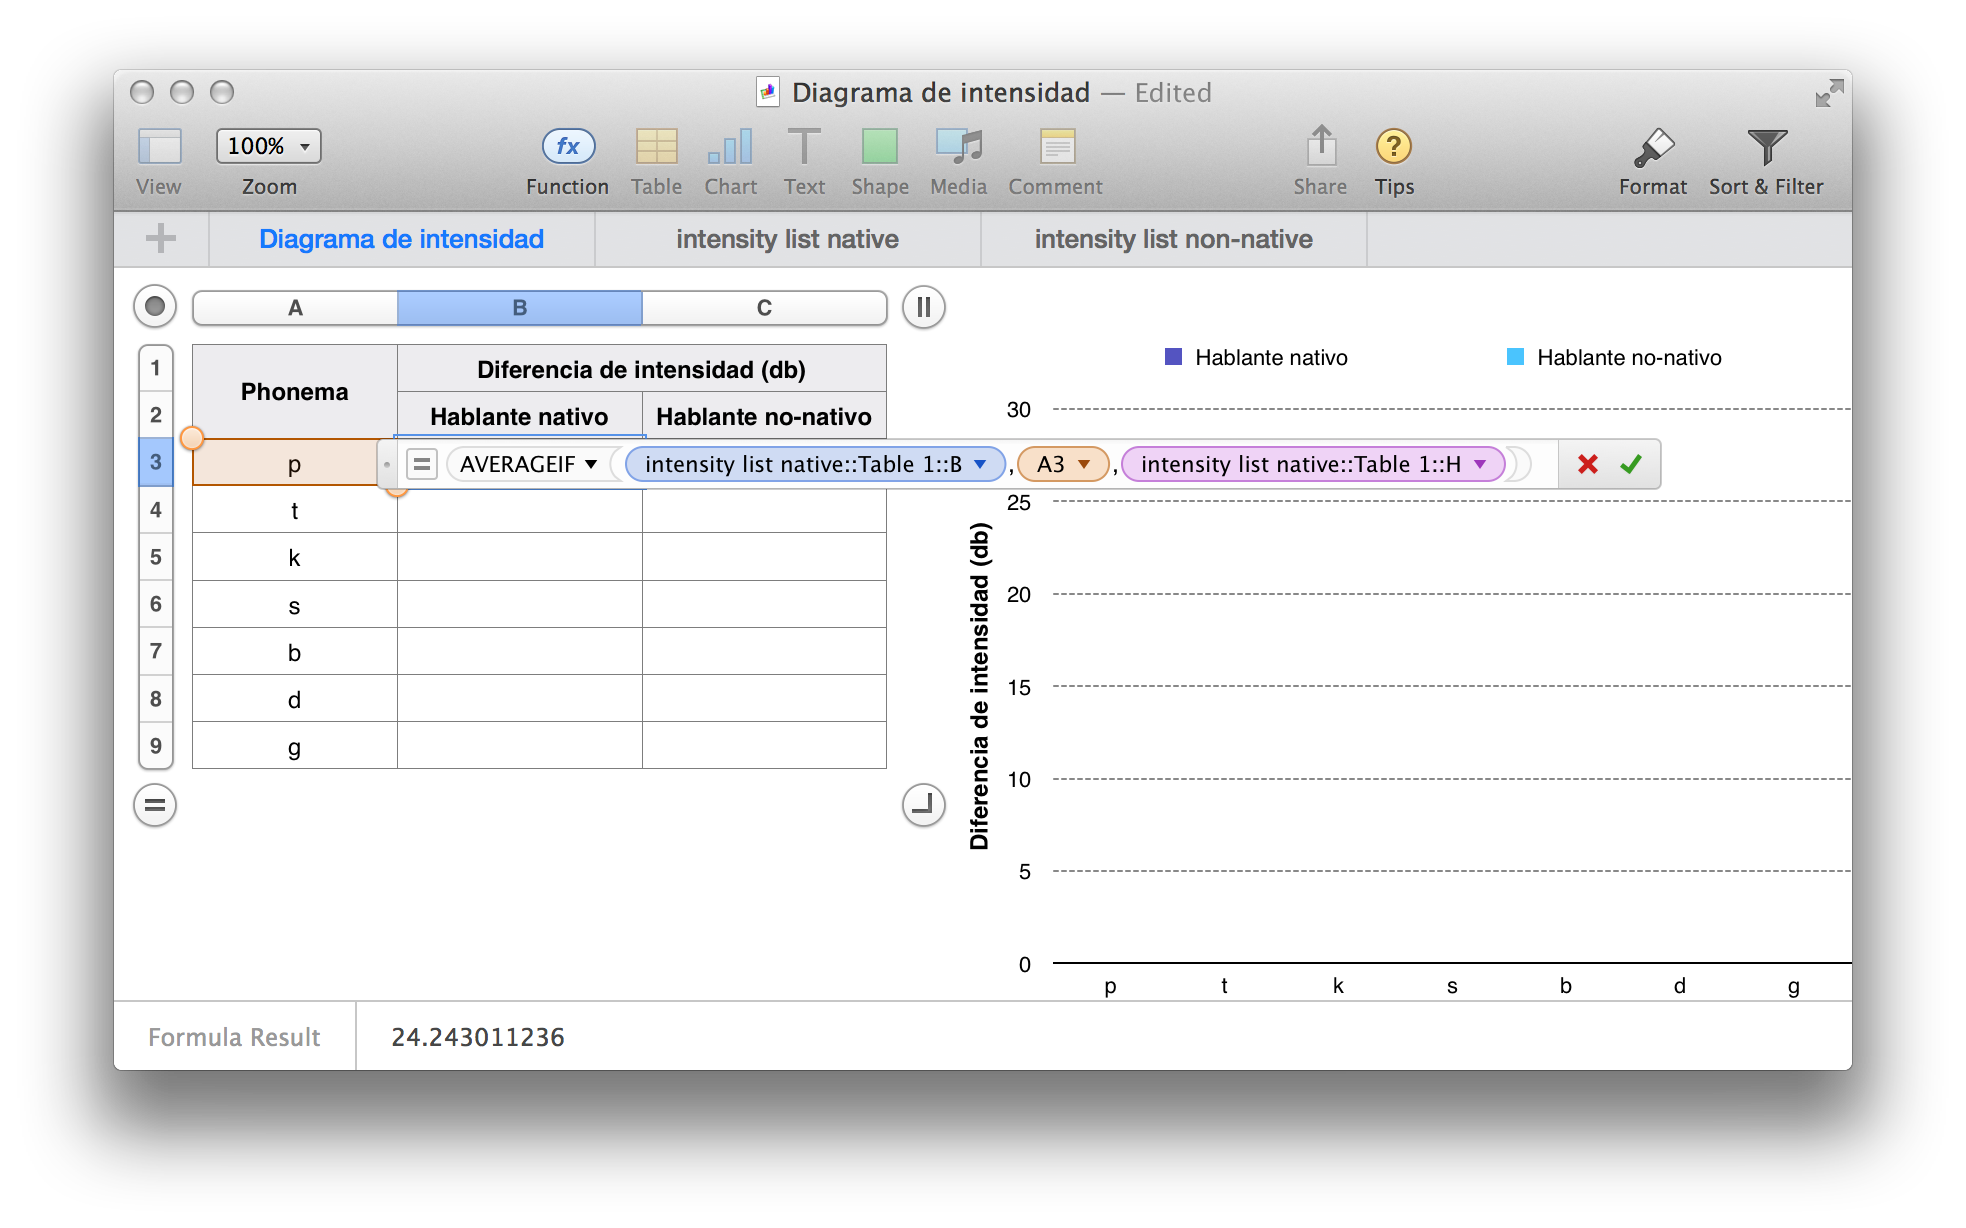
So in cell B3, type =AVERAGEIF(, then head to the sheet with the intensity list of the Castilian speaker (i.e. intensity list native) and click on the header B to select the column titled Interval name as the first argument, then type , (comma). Next click on Diagrama de intensidad tab to go back to the intensity chart seer and click on the cell A3 to indicate that the criteria is the phoneme in that cell. Then type , (comma), head back to intensity list native sheet and click on the header H to select the column Int difference as the third argument. Finish the formula by typing ) (left parenthesis) and press Enter. Your formula should look like the one shown below:
-
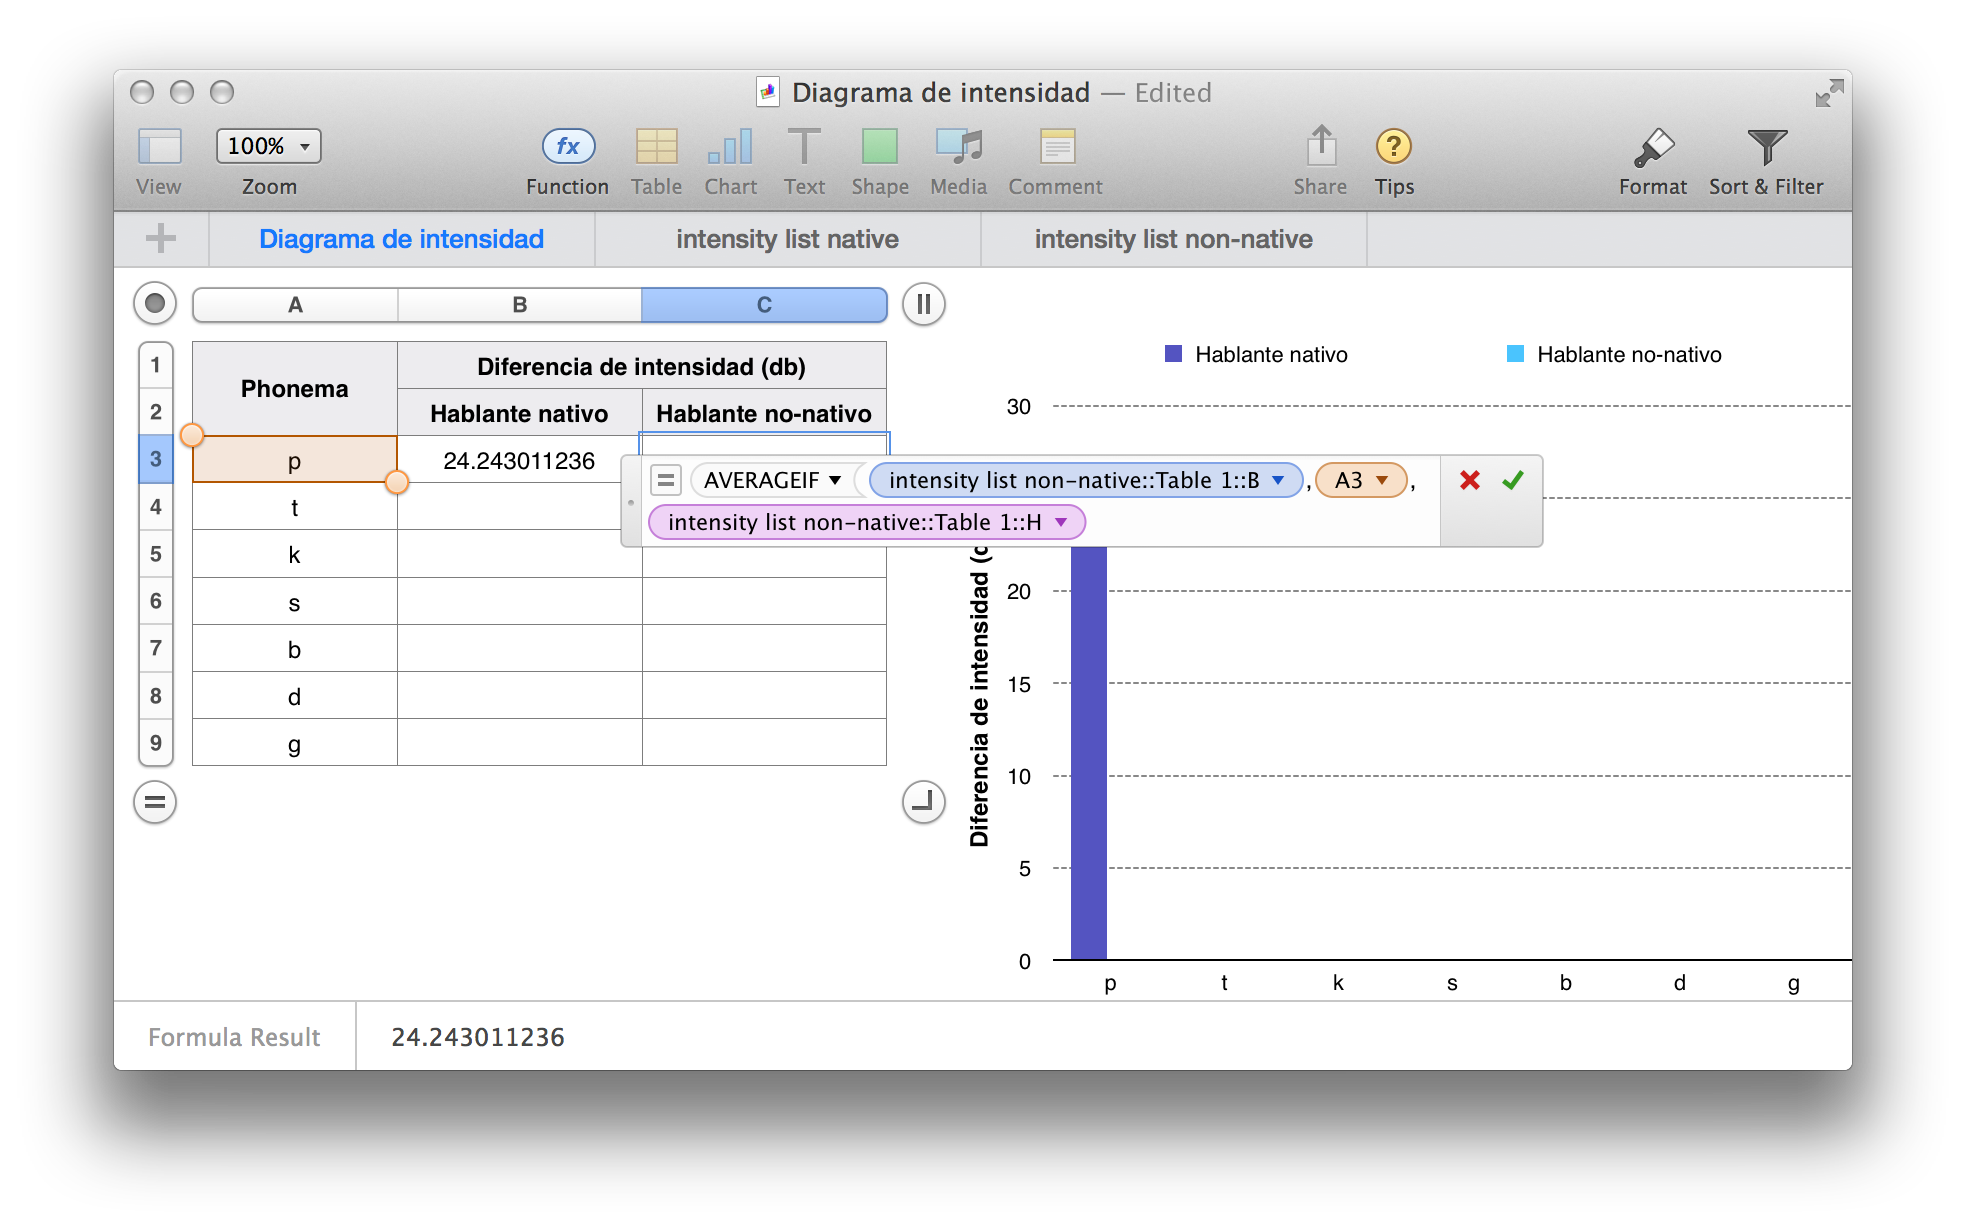
Now let’s calculate the intensity difference of /p/ for the Andalusian speaker. In cell D4 of Diagrama de intensidad, type =AVERAGEIF(, then click on the header F in intensity_list_non-native.xls sheet to select the Interval name as the first argument, then type , (comma). Go back to Diagrama de intensidad and type B4. Then type , (comma) and click on the header H in intensity_list_non-native to select the column Int difference as the third argument. Type ) (left parenthesis) and press Enter. Your formula should look like the one in the screeshot below:
-
Fill the formula into the rest of the table. Select cells B3 and C3 and then drag the small yellow circle on the bottom of the selection across the rest of the cells in the table. The bars should appear in the intensity chart.
What’s next
Data submission
-
If you used numbers, export the spreadsheet to Excel. In the menu bar, click File, Export To, and then Excel…. Click Next… and then save the file.
-
Rename the Excel file so as to include your name(s) (e.g. Henriksen_Nick_AD1.xlsx). Submit that Excel file via Canvas by 2 November, per syllabus.
Report
-
Write a report in Spanish as per the requirements on Canvas. Include your intensity chart (in Excel, right-click on the chart and click Copy, then paste the chart in a word processor). Once you have finished with your report, review it checking that you have made no errors and that you have included all the necessary components and details.
-
Submit the hard copy of the report in class on 9 November.