Publications
Graph** below provides an overview of my research. The branches represent research directions. Nodes represent papers (click on circles to go to papers). More traditional layout of my publications can be found below or on Google Scholar along with a citation file. You can click and drag the nodes to play with the graph :)
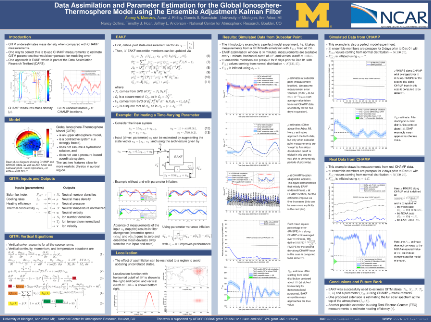
Posters
|
2012_AGU
|
Invited Talks
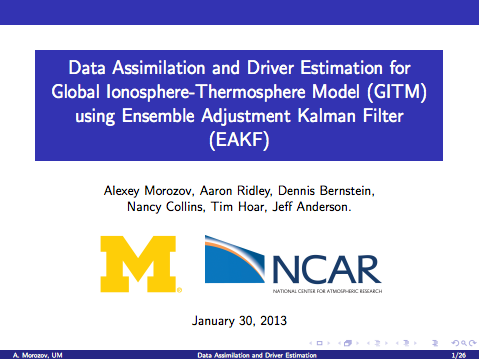 |
2013_IMPACT
|
impact.pdf, impact.tex, and theme.sty. |
Papers
|
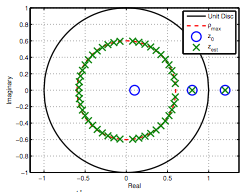
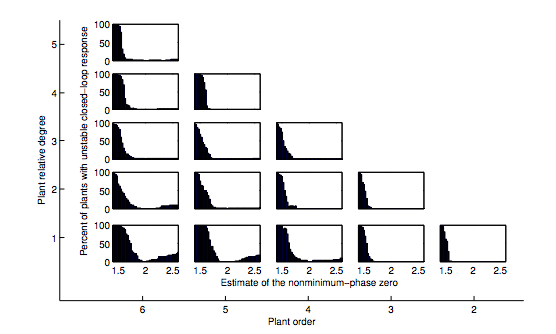
2010_Zeros
|
 |
2010_Computational
|
 |
2010_Linkage |
 |
2011_Convex |
 |
2011_NASA |
 |
2011_Model_Refinement |
 |
2011_Markov_Parameters |
 |
2011_Linkage |
|
2013_JASTP | |
 |
PhD Thesis |
| |
PhD Defense Presentation |
(*) Disclaimer:
This material is presented to ensure timely dissemination of scholarly and technical work. Copyright and all rights therein are retained by authors or by other copyright holders. This statement comes from Eduardo Sontag's page.
(**) This applet is a modified version of mbostock's code (which is an application of Data-Driven Documents (D3)). This page is a work in progress, but you can see the code by right clicking and selecting View Page Source. It's somewhat confusing, but if you have questions, send me an email, or check back often as I plan to make the code prettier and add functionality (colorcode branches, sort by year, replace circle by an image/formula from the paper, etc.). If you can not see a label, just drag the node out of the way.
| Home | Code | Projects |