Code Snippets
|
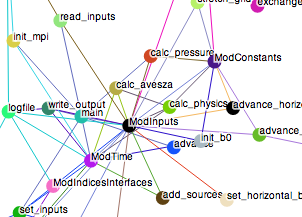
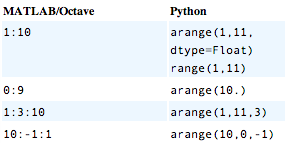
D3.js + Python dependencies visualizationThis project dealt with visualizing the code for GITM (the space weather model I use for my research) and DART (a suite of ensemble filters used for data assimilation on GITM). Both DART and GITM are written in fortran, so once I wrote the Python script, I could visualize both. The visualization itself is done in D3.js, whereas the "reading the code" part is done in Python. Here is the GITM graph, here is the DART graph, and here is the script (and a simpler version). Matlab-Python Rosetta StoneHere is my version and here is somebody else's (who also has one for IDL, one for R, and a composite pdf). |
|
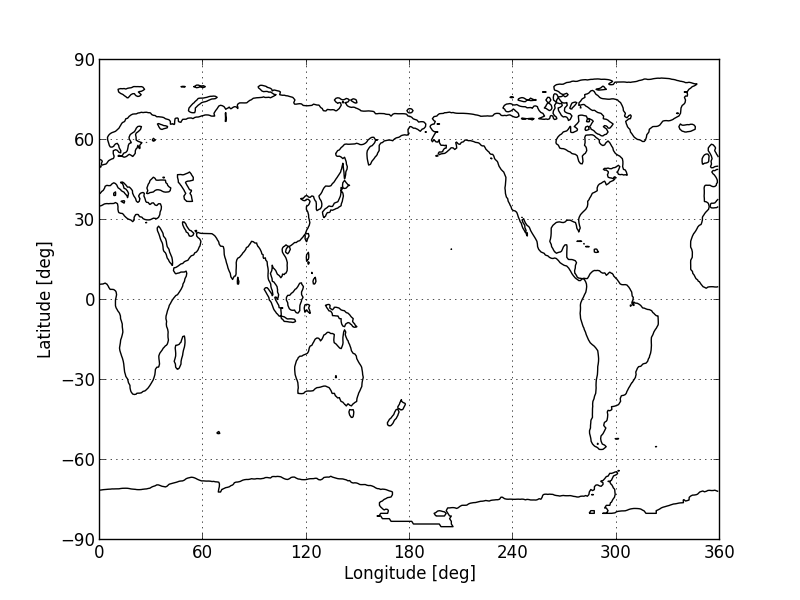
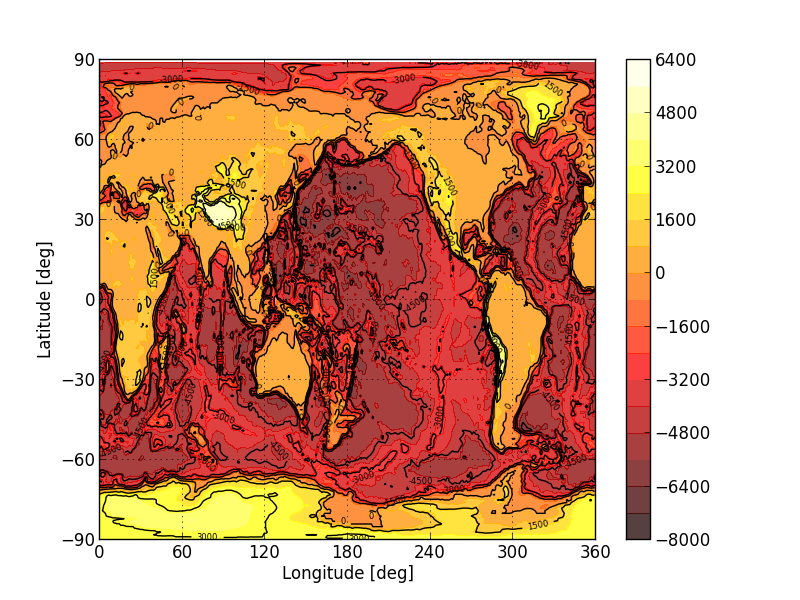
Plotting a map in Python without mpl_toolkits or basemapSome servers don't have basemap installed, but if you want a quick workaround, here it is! All you need is map.txt and map.py. It is set up right now for plotting the shorelines, but if you want colors, uncomment lines 27-31. I got the topographical data from Matlab's "load('topo.mat','topo','topomap1')", which in turn comes from NOAA's data announcement 88-MGG-02. |
|
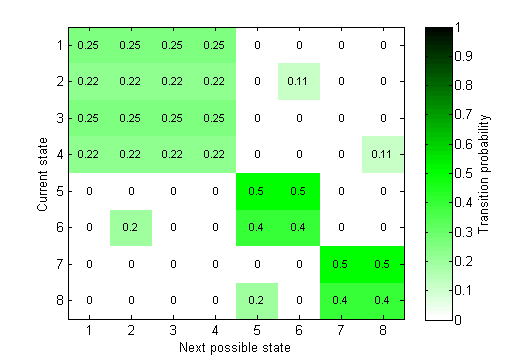
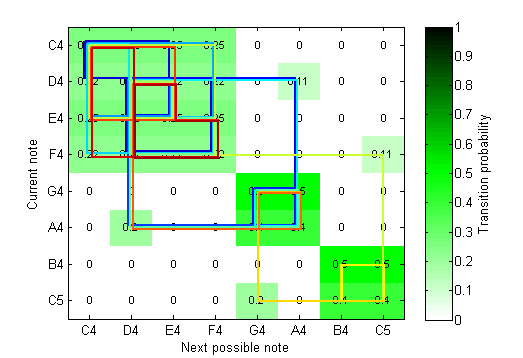
Markov Chain Music GeneratorI wrote this while learning Markov chains (MC) to understand how the structure of the transition matrix affects the evolution of the process. This particular example has 8 states, each representing a note. For example, when Markov chain is in state 1, the code will play C4, when in state 2 - D4, 3 - E4, ... 7 - B4, 8 - C5. Initial state is picked randomly (in the realization I'll show you in a minute it turns out to be 4). The next state is picked randomly in accordance with the transition matrix (shown in green on the left), ie from state 4, MC can only go to 1, 2, 3, 4 (stay where it is), or 8. Then from 8, it can go to 5, 7, or 8 and so on. You will notice that the transition matrix is divided into 3 blocks. Of course other transition matrices are possible, but I picked this one to try to mimic the final piece of the duel scene in The Legend of 1900 (ie make MC use a block of notes for a period of time and then jump to another block and stay there for a while). The amount of time MC spends in one block can be controlled by the magnitude of the transition probability to another block (if transition is very unlikely, it will stay in the current block for a while). Accordingly, my conjecture was that by tuning the transition probabilities I could get close to the music in the movie (structure of the matrix also has great influence, but let's leave that aside for now). The result I get (audio and animation combined) is shown in this video. I'm experimenting with other matrix structures (making use of chords, playing multiple notes at the same time) and these videos (and initial matlab code) will make it here eventually. |
|
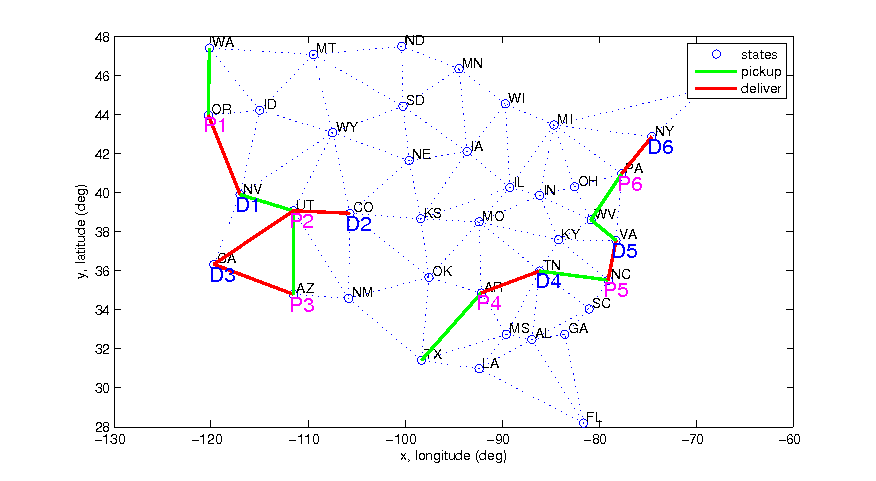
Unmanned Package Delivery
This is my part of the group capstone project I worked on while in Information Systems (AE740) course. It proposed to automate FedEx's operations by using large number of UAV's instead of small number of regular planes. My part of the project was in answering the question "If you were to indeed do this, how would you optimize the path planning?" The solutions that already exist include Dijkstra, A*, D*, etc, but what we wanted to do is to use the code we already had for the first two and adapt it to the multi-agent problem. The result on the left is one such simulation where A* is used to route between current location and package (pick up and drop-off). The optimization as far as which UAV gets what package is not too sophisticated and uses a simple greedy approach for now. Feel free to browse the final report, and the actual code (my sections are titled Search and Planning). Eventually I'll upload some simulations.
|
|
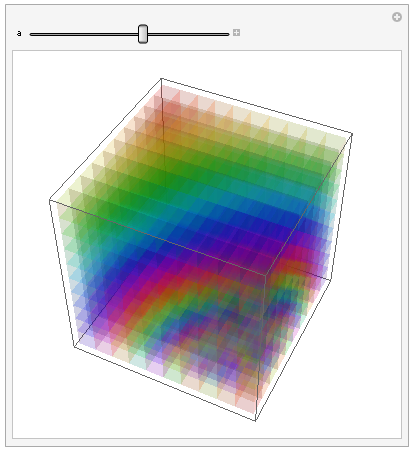
Mathematica VisualizationsI really enjoy visualizing data interactively, so here is a page with a few of the Mathematica manipulations. |
| Home | Publications | Projects |