Data Input and Statistics in IDL
Prof. J. D. Monnier
2008 Winter
In this computer lab, you will learn how to read in data and write functions. You will be writing your own functions to carry-out basic statistical analysis of data.
[for those on web, the following external files will be needed to carry out this lab: FILES]
One of the most important functions of a data analysis package is importing data stored in a variety of formats. IDL has some data formats built-in or programmed in the Astronomy library such as FITS. For instance, one can read in data from the Hubble Space Telescope using available libraries. You have already learned how to read in FITS files in the first tutorial.
Often, your data will not be stored in a 'standardized' data format like FITS, but rather just recorded in ASCII format -- the numbers are just written in a text file. One can use a variety of methods to read ASCII data into variable arrays inside IDL. Lets try a few.
Ia. Reading in Data: Method 1: ascii_template()
IDL provides a GUI-based tool to help read in tabular data found in ascii files. The benefit of this method is that it is quick and easy -- however, it does not lend itself to scripting or automatic data processing.
First, look at the datafile in 'as361/Idlstuff/AY361/' directory called 'data1.txt' using the idle environment.
data1.txt:
Header Line 1: Sample data for AY361
-50.0000 -0.00264704
-49.0000 -0.0120685
-48.0000 -0.0188662
-47.0000 -0.0212358
-46.0000 -0.0183961
etc...
You see that the first line is text header followed by two columns of numbers. You can use ASCII_TEMPLATE() to define template to be used by the IDL program READ_ASCII() to painlessly absorb text data.
IDL> data_template = ascii_template() ; choose 'data1.txt'

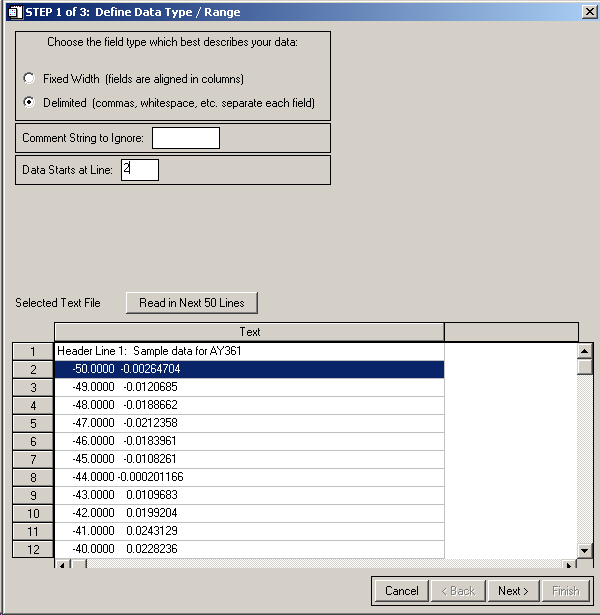
The bottom of the GUI shows you the file, while the top allows you to specify a few parameters. In this case we want to use 'Delimited' data and want to start reading data on line 2. It is common in ASCII data files to utilize a Comment String to make things more human-friendly -- you will see later that the Small Radio Telescope produces a data file which starts all comment lines with a '*' -- ASCII_TEMPLATE() provides an easy mechanism for ignoring these lines when reading in data.
OK, After setting things up as outlined above, hit Next>

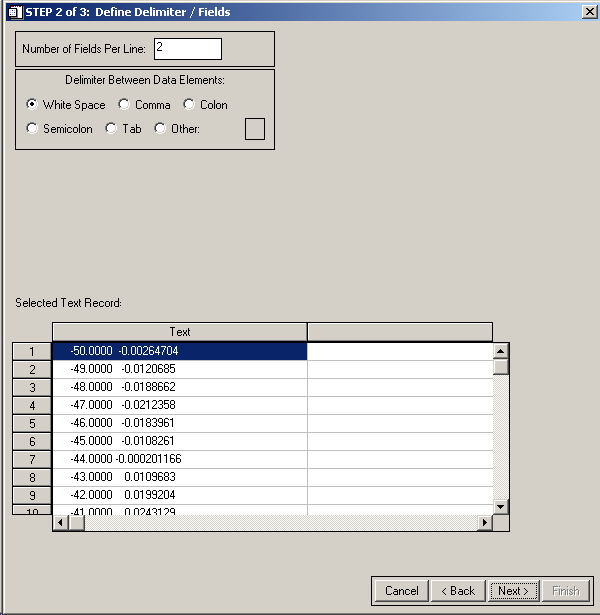
We are using White Space to delimit columns in this file and we see there are 2 fields per line. Set this up and hit Next>

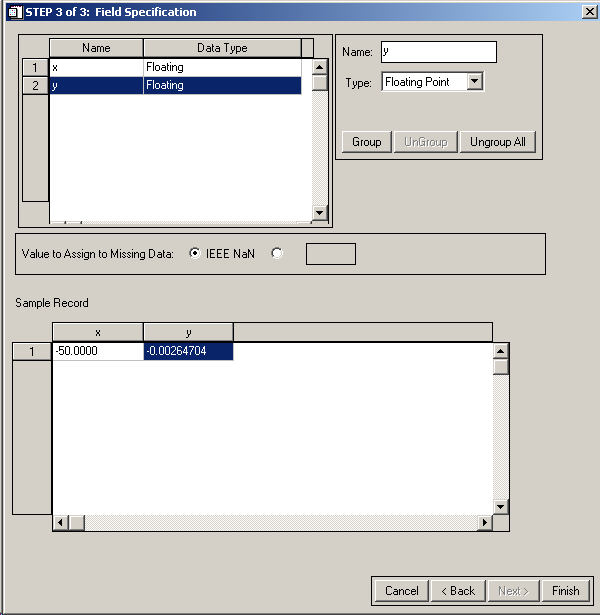
Click on the 2 different fields and change their names to 'x' and 'y'. Note that the program has automatically detected the data types of the fields (Floating Point), but allows you to specify something different. Hit Finish.
This has returned to IDL a structure (more info on -structures- below) containing the information on the ascii template. You can now attempt to read in the data and see if it correctly parsed the file:
IDL> data = read_ascii(template = data_template, header=header) ; you will have to choose data1.txt again.
IDL> help,data,/structure ; look at the data fields in the structure DATA (you can also use the Variable Watch Window to interrogate structures)
Those with little programming experience will recognize a 'structure' as a hybrid data type customizable for one's needs. In this case, DATA is a structure which contains a 100 element array called X and one called Y (you see how these names were defined in data_template using ascii_template(). Accessing the elements of a structure is simple by using a period '.' [Please read online help on structures for more info -- '? structures']
IDL> print,data.x
IDL> print,data.y[10:50]
IDL> plot,data.x,data.y,xtitle="X",ytitle="Y"
read_ascii() has a number of keywords (see online help). For instance, the lines which are skipped at the beginning of the file can accessed using the keyword HEADER.
IDL> print, header ; see the original read_ascii call above
![]() Please create a postscript plot of this line plot in 'YourName.data.ps'
Please create a postscript plot of this line plot in 'YourName.data.ps'
Ib. Reading in Data: Method 2: read_ascii() only
For very simple data files like 'data1.txt', it is very easy to skip the ascii_template() step entirely after a simple visual inspection of the datafile. Again -- read the online help for read_ascii() for more information.
IDL> data2= read_ascii(data_start = 1, delimiter = ' ', header=header2) ;comment there is a blank space in delimeter=' <space>'
IDL> help,data2,/st ; keywords like /stucture can be abbreviated as long as the abbreviation is unique
You see that all the data is saved in an array called FIELD1. Depending on the version of IDL, you might see that the array is 7 x 100, which is obviously wrong. This is a bug in this version of read_ascii which counts the number of columns in the first line (header) instead of the first data line. Using IDL v5.4, FIELD1 has the correct dimensions (2,100). Despite this flaw, it still works enough to make a plot.
IDL> plot,data2.field1(0,*),data2.field1(1,*),xtitle="X",ytitle="Y",line=2
Ic. Reading in Data: Method 3: Using a procedure or function
One can also write custom functions or procedures to read in data files. This can be simpler in the long run if you have read in data over and over again and the data format does not change much. Look at the program called 'custom_data1.pro' in 'AY361/General_Files' which you used in last tutorial. This program shows basic programming elements of IDL that you can use in your future data analysis programs. It can be utilized as follows:
IDL> filename = dialog_pickfile() ; choose data1.txt
IDL> custom_data1,filename,header,x,y
IDL> plot,x,y
Alternatively, one can return the data in a function call as a structure. See the file custom_data2.pro, which more closely replicates the usage behavior of read_ascii():
IDL> data3=custom_data2(filename,header=header)
IDL> help,data3,/st
IDL> plot,data3.x,data3.y,line=3
II. Statistics Lab
In order to complete this section, you will need to write your own individual programs. You will be writing routines to calculate any TWO of the following statistical measures.
For extra credit, you can write a routine to estimate the Error of the Mean (Standard Error) using Bootstrap Sampling [see me for more information on this statistic -- http://www.stat.wisc.edu/~larget/math496/bootstrap.html]
For hints and to see some useful IDL methods in practice, see the example function: john_mean.pro in 'as361/Idlstuff/AY361'. You can see that it works:
IDL> print, john_mean([1,2,3,4,5,6])
3.50000
![]() For purposes of grading, please name your procedures beginning with your uniqname and copy your final results to the 'as361/Deposit' directory.
For purposes of grading, please name your procedures beginning with your uniqname and copy your final results to the 'as361/Deposit' directory.
In order to test your routines, you will need to run your functions on a some standard data. For "Mean Absolute Deviation" and "Standard Error," use the list of numbers in "data_simple.txt" in 'as361/Idlstuff/AY361'. For the weighted mean, use the two columns of data in "data_wtdmean.txt". For the covariance, use "data_covar.txt"
![]() The last graded part of your lab will be to create a script that loads in the standard data, applies your functions, then prints the results. Be sure to follow directions on how to create a script from the last Tutorial and name it: 'UNIQNAME_STATS.script'
The last graded part of your lab will be to create a script that loads in the standard data, applies your functions, then prints the results. Be sure to follow directions on how to create a script from the last Tutorial and name it: 'UNIQNAME_STATS.script'