| Simulation: power analysis for array experiments | ||
| Back
to array experiments |
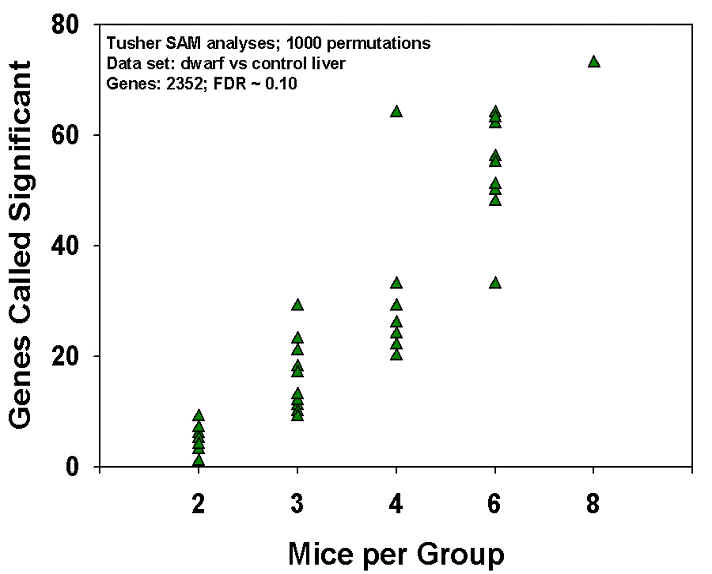
The figure shows a computer simulation experiment. The data (from Dozmorov, Galecki, Chang, Krzesicki, Vergara and Miller, "Gene expression profile of long-lived Snell dwarf mice," J. Gerontol. Biol. Sci., in press) reflect a comparison of eight young normal to eight young dwarf mice for expression of 2352 genes in liver. In the actual experiment (8 mice/group, show at right in figure), we found 72 genes that were called significant using the Tusher "SAM" algorithm, using a false discovery rate criterion of 0.1. In the simulation, we picked 10 different random sets of 6 mice (or 4, or 3, or 2) from each group, and calculated the number of significant genes; each simulation is shown as a separate symbol in the graphic. For simulations of six mice/group, for example, individual simulations found as many as 64 or as few as 33 significant gene changes. For simulations in which each group contained only 3 mice, in contrast, no experiment found more than 30 significant changes.
|